
Introduction
The Australian housing market is booming. Prices are rising sharply, auction clearance rates are very strong, sales are surging, and housing finance is around record highs. This is being driven by record low mortgage rates, multiple home buyer incentives, economic and jobs recovery, pent up demand, activity associated with a desire to “escape from the city” and an element of FOMO (fear of missing out). Forecasts for prices to rise 15% to 20% in total across this year and next now seem consensus. So here we go again with yet another cyclical property boom against the backdrop of poor affordability and high debt levels! Of course we all know this, but how does the latest upswing fit in the context of the long-term or secular swings in the Australian property market?
Mega booms and busts in Australian home prices
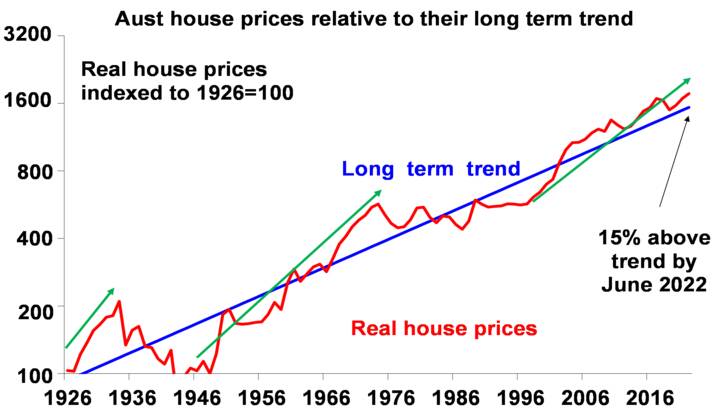
The next chart shows real Australian home prices (average property prices after removing increases in consumer price inflation) indexed to start in 1926 at 100 (red line) against their long-term trend (blue line).
Source: ABS, AMP Capital
Over the last 100 years real property price growth has averaged around 3% per annum in Australia which out of interest is in line with long term average real GDP growth (which is a rough proxy for long-term income growth). While property prices go through lots of short-term cycles, these are less noticeable when annual data is used as in the last chart. In a big picture context, we can see that real Australian property prices have gone through three major long-term booms (highlighted with green arrows) and two major long-term busts or weak periods over the last century.
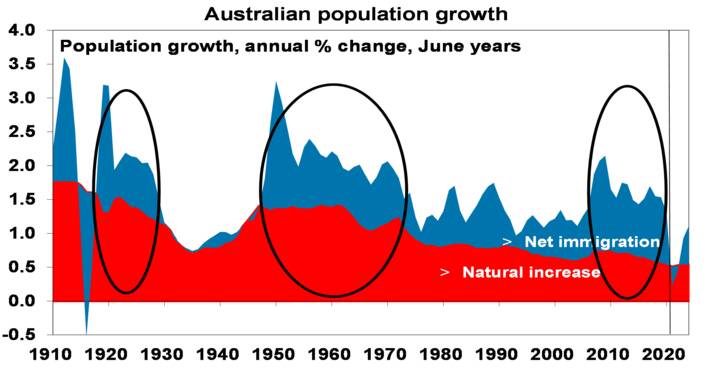
- The first long term boom was in the 1920s and was associated with strong economic conditions and very strong population growth from the end of WW1 until the early 1930s. See the first circled area in the next chart.
- This was followed by a collapse in property prices associated with the Depression, a plunge in immigration and natural population growth and the early years of WW2, with real prices not bottoming until 1943 – maybe after many in Sydney’s Eastern suburbs sold up in response to the 1942 midget sub attack on Sydney Harbour & moved to the Southern Highlands!
Source: ABS, AMP Capital
- The second long-term boom got underway after WW2 and ran into the early 1970s supported by very strong economic and population growth (see the second circled area in the population chart). This saw real property prices rise from 50% below their long-term trend to be 50% above trend by 1973.
- This long boom ended in the mid-1970s with the economic malaise of the time, a step down in population growth and the high interest rates of the 1980s. Unlike the collapse of the first long-term boom, it saw real house prices churn sideways in a wide range with some strong periods along the way (such as in 1988-89 in the aftermath of the 1987 share market crash). But because of a 20 year plus churn in real house prices by the mid-1990s real prices were more than 20% below their long-term trend. This was a great time to get into Australian property.
- This in turn set the scene for the start of the current long-term boom in property prices in the second half of the 1990s, that has taken real property prices from well below trend to well above trend (consensus price forecasts would see them 15% above trend by mid next year – see the first chart).
The current long-term boom was initially set off by the shift from high to low interest rates with mortgage rates dropping from around 17% in the very early 1990s and trending down the point that they can now be found for less than 2%. Through the first half of the 1990s this was offset by recession and there was a fear that rates would bounce up again. But through the second half of the 1990s the trend to lower rates became entrenched and believed. At the same time financial deregulation and increased competition in the home lending market led to easier access to debt. This with the growth of two income families combined to result in home buyers being able to borrow more and hence Australians being able to pay each other more for property. So, prices & household debt surged.
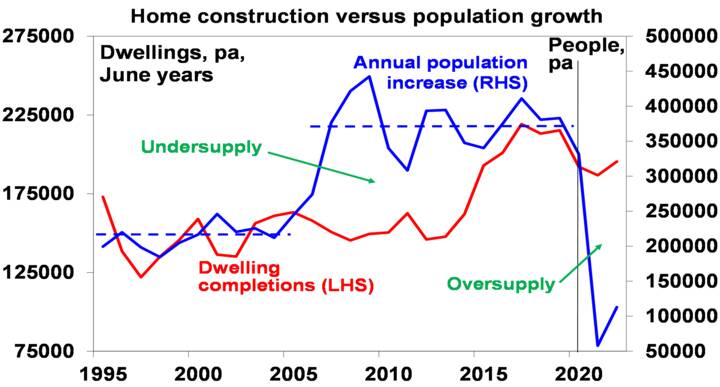
Normally the resultant surge in property prices – with average prices up 11% per annum between 1998 and 2004 – would have led to a surge in supply which would have brought prices back to earth, but this was thwarted from the middle of last decade by a surge in underlying demand for housing. This can be seen in the next chart.
Source: ABS, AMP Capital
Annual population growth surged from around 2005 with average population growth rising from around 215,000 pa over the decade to 2005 to 370,000 over the 2006 to 2019 period, which would have implied roughly the need for an extra 50,000 dwelling per annum but supply did not start to catch up until after 2015, which led to a chronic undersupply of housing.
This combined all goes to a long way to explain how Australian housing went from cheap in the mid-1990s to expensive in the early 2000s and has stayed there ever since. Tax breaks for property and foreign demand at times may have also played a role but the main drivers have been the combination of low rates and an undersupply of property where people wanted to live (big cities). Other countries have low rates and tax breaks too, but they have kept housing more affordable because of a better supply/demand balance eg, according to the Demographia Housing Affordability Survey the median multiple of house prices to income is around 6 times in Australia compared to 3.5 times in the US and 4.5 times in the UK and in Sydney and Melbourne its around 10 times.
The long boom may be close to the end
Our own forecasts see house prices rising another 15% or so out to end 2022, although the pace of growth will likely slow thanks to worsening affordability, likely higher fixed mortgage rates and a likely tightening in lending standards. But there are good reasons to believe that the long-term boom in Australian property prices may be close to an end. The last two long booms were bought to an end by Depression and stagflation which hopefully won’t be the case this time. And it’s not necessarily the case that it will end with a crash either. However there are three reasons why it may fade in the years ahead:
- First, the long-term decline in interest rates that began in the early 1980s with bond yields and then spread to Australian mortgage rates interest rates in the 1990s looks like it might be at or close to the bottom. The RBA and other central banks are now resorting to more extreme measures to get inflation back up & some of the structural forces that drove inflation down over the last 40 years, like globalisation and deregulation, look to have run their course. If inflation is bottoming, then so will interest rates and the super cycle of each new economic slowdown leading to even lower mortgage rates and ever higher debt levels driving ever higher house prices relative to wages will come to an end.
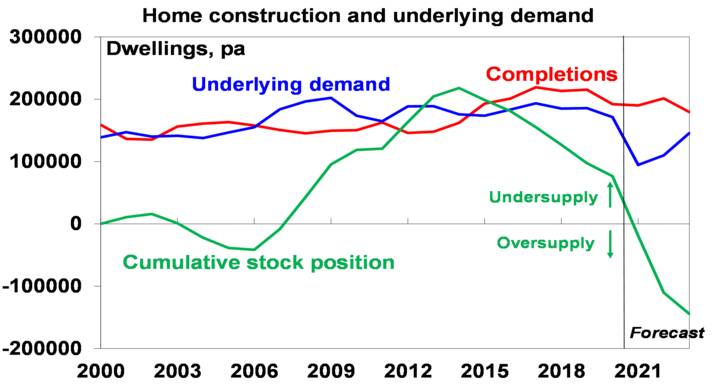
- Second, the chronic under supply of property may be starting to fade thanks to the unit building boom since 2015, the hit to immigration and home building incentives which are likely to keep house building high for the next 12 months at least. As evident in the last chart, supply is likely to remain strong this year and next, but population growth has collapsed implying a shift from property undersupply last decade to oversupply. This can also be seen in the next chart which shows our estimate of underlying demand for housing (blue line) based on population growth and demolitions versus completions of new dwellings (red line). The cumulative balance is shown with the green line and indicates that the surge in underlying demand from 2006 led to an undersupply of more than 200,000 dwellings by 2013. The collapse in population growth has likely now seen this move back to balance and if population growth remains as weak as the Government is projecting over the next two years, and construction stays up, we will move into a clear oversupply. This will be healthy in terms of improving housing affordability for new buyers and renters.
Source: ABS, AMP Capital
- Finally, the pandemic has seen a profound shift in how office workers work. The work from home (WFH) phenomenon is likely to remain, albeit not five days a week for all. This means less need to live close to work and a greater focus on lifestyle, meaning greater demand for houses in outer suburbs, smaller cities and regional areas which are generally more affordable. It may also mean a significant conversion of CBD office space (as WFH goes from 1 day in 10 pre pandemic to 2 days in 5 post pandemic) to residential, again boosting housing supply.
Concluding comments
The Australian property market has continuously surprised on the upside over the last two decades and it could continue to do so: there could be one last low in interest rates (negative rates anyone?); population growth may bounce back faster than expected once borders reopen; and once the pandemic is over Australians could forget lifestyle and return to the rat race. That said there are good reasons to expect that the forces that have driven average Australian capital city property prices well above trend and well above price to income ratios seen in other comparable countries over the last two decades may be at or close to having finally run their course. Of course, Perth and Darwin may be exceptions to this having just emerged from deep six-year bear markets.

