
Commodity prices are largely driven by the strength of demand versus suppliers’ ability to meet those needs in a timely way. Growing the supply of non-renewable commodities like oil, relies upon technology to squeeze more from old resources and finding plus developing new discoveries that often have technical challenges.
The last decade has seen the US massively apply horizontal drilling and hydraulic fracture stimulation technologies to its extensive hydrocarbon bearing shales. This catapulted the mature US oil industry to become the worlds’ biggest crude oil producer. US output peaked at 13.1 million barrels per day (mb/d) by March 2020. This was up a staggering 3 mb/d since early 2018. However, the US requires a high rate of drilling, cashflow and/or debt to continually replace the flush production from newly fracture-stimulated wells. The Covid-19 induced demand slump saw oil prices plummet as there was inability to sell all the output, nor is there free cash available to continue a high drilling effort.
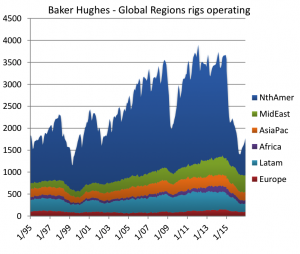
US oil production has since spectacularly fallen to 10 mb/day as high cost wells were shut-in and some drilled wells were left uncompleted. As importantly is the 73% fall in oil-focussed drilling rigs, with just 180 rigs still turning versus 733 rigs operating a year ago. The Baker Hughes survey of operating rigs in Chart-1 below shows falls across all regions across the globe. However, it highlights the immense fall in the North American drilling rate and also Latin America’s a big slide in development activity.
Chart – 1 US and Canadian drilling effort falls the most among the regions
We think the rapid responsiveness of drilling in the US and across the broader America’s has its roots in high overall operating/capital costs of these fields, compared to OPEC. Low oil prices mean that development efforts in US shale or expensive offshore Brazil developments are simply delayed. By contrast the drilling effort continues only with a modest cutback in the Middle East. This region’s output is dominated by key OPEC members. At lowish oil prices, they are likely to regain part of their lost market share going forward from a very low base, as occurred in 2016-17 – see Chart-2 below.
Chart-2 – Major producing area’s oil & liquids market share in %: IEA & OPEC data
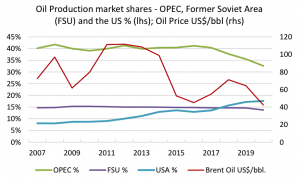
The last decade’s unchecked rise in the US market share of global oil and liquids supplied to over 18% by early 2020 (estimated from OPEC’s and IEA data) has likely come to an end for now for two key reasons:
On one hand OPEC and its some-time ally Russia, will seek to protect and rebuild market share vital to their economies from their currently unused capacity. On the other hand, US private oil company balance sheets are compromised, and dampened oil prices restrict corporate cashflows to re-invest. This means the America’s oil companies will require a strong demand and price signals to dramatically increase drilling to first offset declines, and then to consider growing output strongly once more.
The extent of the US swing-producer response to a post-Covid oil demand rise, and OPEC’s & Russia’s counter-response, will have a big bearing on the sustainable level of oil prices in the coming decade.
Sources: Baker Hughes, US Energy Information Agency, IEA, OPEC Research

