
Combining attractive chart patterns with exciting fundamentals is in essence the perfect marriage every investor should be looking forward to. Not only does it increase the probability of success but it also improves the timing of quickly achieving a return on your investment.
I spend the majority of my day looking for such opportunities and by ensuring that I look for both a positive chart pattern AND good fundamentals it helps ensure that I (for the most part) avoid the two biggest trading traps:
- The value trap – where the fundamentals and valuations looks cheap, but the share price keeps falling
- The false break – where the chart looks exceptional, but the fundamentals don’t match and the chart breakout ultimately fails
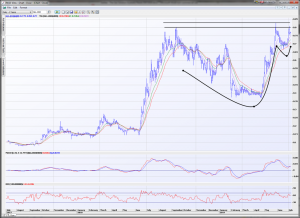
Naturally, when the perfect combination surfaces the size of my bet also increases. One that has reached this point is Galilee Energy (GLL) which is on the brink of multi-year highs through the 80/83c zone as shown below. This resistance stretches back to August of last year and commonly when such levels break, combined with the lack of resistance thereafter and the momentum leading into the breakout can see share prices double.
The most attractive part of the technical formation below is the price action of the past month. It is what we call the “handle” in a “cup and handle” formation. I have done my best to show the “cup” and GLL is about to complete the handle formation where the weakness has importantly managed to hold the supporting moving averages perfectly. Those that are well averse with technical patterns will know the significance of this but for those that are not here is a brief explanation. The profit taking or general selling that resulted from the failed attempt to breakout a month ago, is quite shallow. After all it has only retreated 15c, reflecting strong underlying support. By holding above the moving averages, momentum is still positive and strong. By keeping this latest pullback relatively shallow, when the next wave of buying comes it is doing so from levels, close to a breakout leaving plenty of room to rally once through to new highs. If this rally were to occur from much lower levels, by the time the share price came to breakout most of the wave of buying has already been done. Thus the handle acts like a springboard.
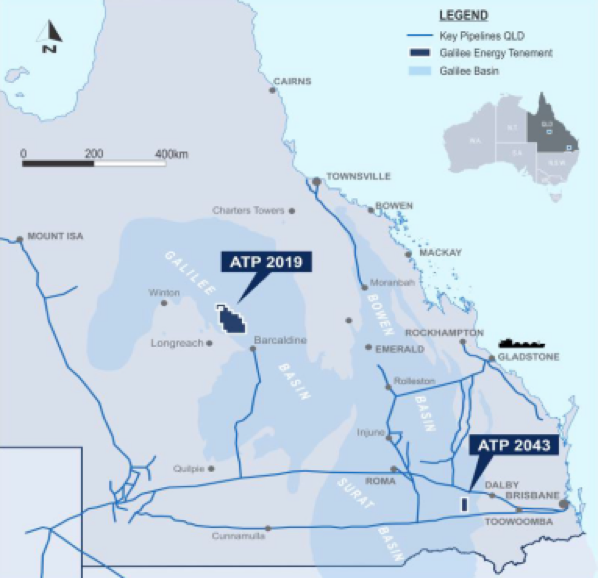
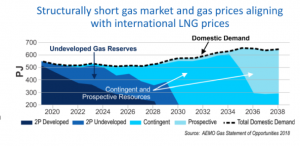
So what is the fundamental driver behind this attractive chart setup and can the share price really double? GLL owns the Glenara gas project in Queensland, west of Brisbane. We all know about the high east coast gas prices due to a shortage of supply with demand continuing to grow over the next decade with very little supply coming on stream to meet that demand. The economics remains of demand exceeding supply for the foreseeable future which equals sustained high prices.
The Glenaras project is a mature project in that it has had over $90 million spent to date and is a significant resource with the Company’s objective to convert this to reserves. The resource estimate of the project currently stands at (2C) 2508 petajoules (PJ). The goal is to convert 500 PJ to 2P reserves which would significantly lift the value of the company and the project. Recent transactions in the coal seam gas sector have yielded values that average around $1.80 per PJ. If this multiple were to be applied to a successful booking of 2P reserves, it equates to approximately $4.50/share! Yes that is more than 5x the current share price. So yes there is enormous blue sky potential for GLL. Even if we were to bring the transaction price down to $1.30 instead of $1.80 still gives a share price target north of $2.00.
The question really is how close is the booking of a 2P reserve and how probable? The company is aiming to book a 2P reserve by Christmas. How probable? This is subjective, so I will say high, but let’s look at the facts.
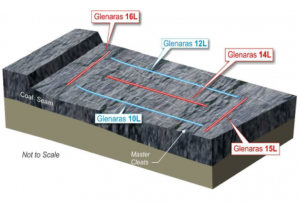
GLL started drlling a three well program last year and the share price in line with general excitement enjoyed a strong appreciation. One of the wells didn’t go exactly to plan and when the Company moved to the de-watering stage there essentially wasn’t enough fire power to drain the project (to allow gas to flow). The project was haltered and a set of two new wells were drilled to now have a five well lateral pilot ready to begin drawing out the water and according to plan in a few months, begin to see strong gas flow. With the lateral wells drilled, this project is now considerably de-risked and provided there are decent gas shows the attention quickly moves to booking a 2P reserve.
As the company begins to prepare for the dewatering the project it’s no surprise that the chart is showing excitement building and explains why above the 80/83c resistance zone why its blue sky. I have been a buyer right up to the 80c level in recent days and will continue to do so once 83c is firmly broken. It is clearly a case of where we can see from a brief look at the fundamentals why the chart looks exceptional and helps support why the marriage of fundamentals and chart patterns can be so powerful in giving real basis to some of these share price targets that can look ridiculously optimistic at first but actually are completely within the realms of reality.

