
Last year in late October I wrote an article Corrections Follow The Same Path: Use It To Your Advantage where I showed that large top formations in major indices follow a similar path. I showed examples of the last 20 years where this has occurred and used this type of repetitive price action to profit because it made me more aware of where the “safe to invest” zone is and where the “be careful” zone is.
In that article, using previous examples, the ASX 200 and the S&P 500 – after a retesting or making new lows in late 2018 – I indicated indices would rally all the way back to their original breakdown levels that were seen mid-year. For the ASX 200 that target was 6,100 and for the S&P500 that target was 2860 being their respective breakdown areas (that triggered us shorting the market at the time) and from our previous analysis and trading, know that markets even at the end of a bull market will still recover almost all of the initial sell-off.
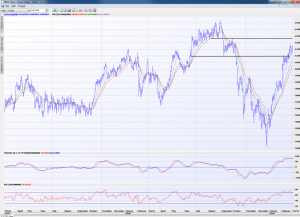
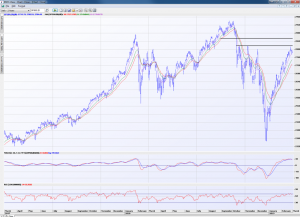
Naturally, as the recover or bounce occurs we begin to fine tune these targets depending on the basis behind the rebound. In the case of the ASX 200, there is a slightly higher breakdown level as shown in the first chart above, at 6235 that the index hasn’t quite reached yet and with the S&P 500 there is marginally lower resistance at 2815 that is proving difficult to breach. In fact, the 2800 level was where we peaked at in March.
Whether we exactly hit each target or exceed them marginally is missing the point. The main point is that we are now at extreme market conditions, which we expected to see, but now is not the time to be complacent and think all is good again in the world of equity markets. Not only are we in the “be careful” zone where history has shown is a significant turning point, but almost all technical indicators are at extreme points. Indicators I don’t even pay attention to are at extremely overbought conditions in much the same way they were extremely oversold near the lows of late 2018. Given this it would be prudent to be cautious.
The charts above show both the MACD and RSI indicators where they have now reached the same heights where the January and September 2018 peaks were made. There is also bearish divergence surfacing – where the market makes a new high but indicators cannot – signaling that much of the underlying buying momentum is drying up. Trending indictors I watch have also stalled out despite indices making new highs making markets vulnerable to stalling out or worse still a bout of profit taking that could be quite sharp.
Can the market break out to new highs and keep appreciating? Sure. Anything can happen and I know markets can persist in trends for much longer than anyone expects. However, the probability I believe is low. Indices have used so much energy working their way back to these breakdown levels in such an aggressive fashion that to have the momentum still push on would be unusual, particularly when the economic backdrop isn’t especially positive. Many uncertainties continue to surface from geopolitical tensions, to economic slowdown fears, trade wars, China slowdown, domestic property contraction and an upcoming federal election.
Also concerning for me is the number of times major market turning points occur in the month of March especially at the end of a cycle or a very aggressive rebound. The tech boom peaked in March 2000, the Post 9/11 of 2001 peaked in March 2002 and then bottomed in March 2003 to start the next equity bottom following the Iraq war, the GFC of 2008 bottomed in March 2009, and even last year the S&P 500 peaked in March after a similar strong rebound – are just a few.
As a result as we head into March and equity markets have staged one of the best starts to a calendar year, I question whether March can back up those gains of the first two months and as markets have unfolded along my expectations from October last year, I stick to my guns and say that this is a time now to “be careful”.

