When corrections surface investors tend to panic and trade on emotion as their investments, profits and wealth takes a nose dive. Action tends to be very similar amongst the “herd” of investors and as a result much of the psychology behind people’s decisions is again very similar. So it’s no real surprise that although arguably circumstances maybe different behind why a market correction occurred, the price action that ensues is almost always identical.
I have been cautious on global equity markets since January and bearish on specific sectors like retail, banks and housing since early-2017 – all factors that signal this is a very late stage bull market in its final act. Markets like the Germany, France, Hong Kong, China and emerging markets have been in steady decline and it has been a matter of when the United States would join in.
The current market correction is part of the broader market topping process that should lead into a very – and I stress – very difficult 2019. By understanding how markets behave during volatility spikes gives investors an ability to calm down and make rational decisions, not emotional ones.
I have used this methodology to profit very well from volatility spikes, knowing what is likely to happen next. I also predicted the 2015 sell-off and subsequent price action (the massive rally back) here on ShareCafe in these series of articles – Tracking Similar To 2011, One Week On – Is 2015 Still Like 2011?, Sometimes It Just Comes Together Nicely. It helped me return my entire yearly profitability targets in six weeks. It is very powerful and not just a recent discovery with no evidence of working in the real world.
Corrections in 2000, 2002, 2008, 2011, 2015 as well as the beginning of 2018 all followed an identical path. The market first experiences a sharp initial decline, there is some violent day to day gyrations with a meaningful rebound. This rebound ultimately fails and we witness a retest of the lows (the first initial decline). Now that retest of the low can form a double bottom or a false downside breach of that low which traps many shorters. Then a rally occurs all the way back to where the initial sell off began from. Thereafter, either the bull market continues or it’s the final selling point before the real bear market begins. Let’s look at examples of both.
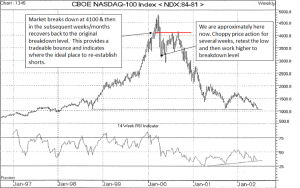
The 2000 tech wreck is a perfect example of this price action and where the final rebound then evolved into a bear market. Below we show the Nasdaq-100 and it can be seen that although there was an initial sell off, we witnessed a retest of the low (in this case a brief false new low was made), followed by a grind all the way back to the breakdown level (shown in red) before the Nasdaq rolled over to begin the bear market.
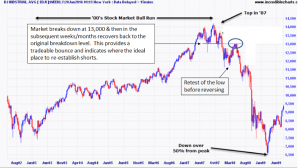
Next let’s look at the 2008 experience that evolved into the GFC. The Dow Jones Industrials is shown below where the breakdown level is shown in blue. We have an initial sell off, a few weeks later a retest of the low (as highlighted) and then a rally back all the way to the breakdown level at 13,000 (circled). The bear market begins from there.
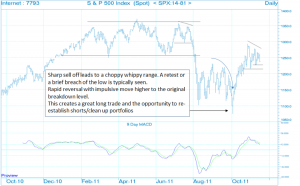
In 2011, as I showed in the links to those prior ShareCafe articles from a few years ago, stock markets experienced the same price action again. The chart below of the S&P 500 is a daily chart, as opposed to the weekly charts above, so it is easier to see the wild whippy price action that typically occurs. However, the same key major turning points are again followed. The initial sell off, followed by a period of whippy day to day violent price action that snowballs into a retest of the initial low. This traps many early bears and then a short covering rally back to where the sell off began.
The daily chart of 2015 displays the same price action once more. This hopefully now provides clarity around all the volatility and wild market swings that occur during and post market corrections.
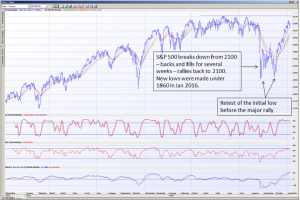
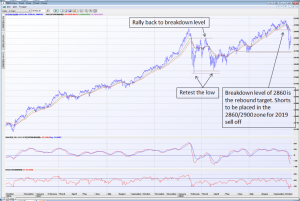
So right now we are in the process of wild day to wild swings where a retest of the lows is still likely to occur. This choppy period can easily last several weeks, but based on historic consistency there will be a rally back to where we sold off from – being 2860 on the S&P 500 and 6100 on the ASX 200. It is at this level and point heading into 2019 that the decision needs to be made as to what 2019 will look like. If you are bearish then this will be an ideal opportunity to conduct the necessary “housekeeping” and/or establish short positions. Following the 2015 rebound – I went into 2016 uber bearish and markets had their worst start to a calendar year in history – based off these historic norms. I again have rising concerns for global markets heading into 2019. Even if you disagree with me, I urge you to still to at least give your portfolios the once over. Don’t be too complacent that the worst is over when we have a meaningful rebound.