
Transient inflation – a look back at 1947

Source: Federal Reserve
What it means
At a time when many commentators are grappling to find an analogy to explain the current inflation episode, we believe it’s worth considering what happened in the United States in 1947.
At the time, the US was beginning to recover from global disruption caused by WWII. Global productive capacity, which had previously been focused on (or destroyed by) the war, struggled to supply post-war consumer demand as soldiers returned home from Europe and the Pacific. Additionally, wartime price controls were removed. Two years later, the US CPI was +14.4%. By 1949, the change in CPI fell to a -1.0%.
Was this decrease driven by a large rate hike cycle enacted by a hawkish Federal Reserve?
No. In fact, the Fed’s 12-month rate increased only slightly from 0.75% in July 1947 to 1.25% in Aug 1948. The real driver was the natural expansion and recovery of US / global productive capacity after a traumatic disruption to normal operations.
Looking back, the 1947 inflation was clearly transitory (despite the two-year lag in CPI data). It begs the question: will we come to the same conclusion with the current inflation episode?
More homes under construction but failing to address cumulative undersupply
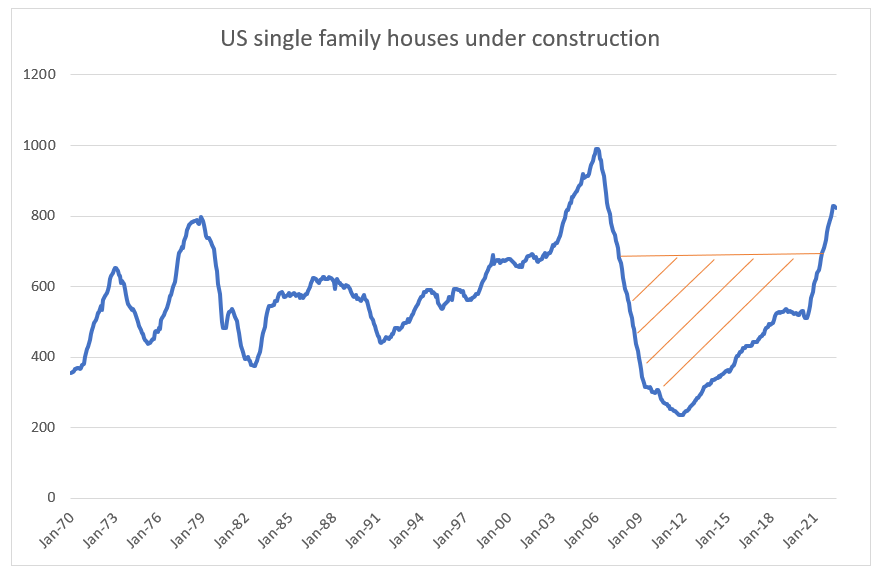
Source: Federal Reserve Bank of St. Louis
What it means
In a post-COVID world, surging demand for housing after a decade of undersupply has driven strong house price growth in the last few years. Consequently, supply has responded, with houses under construction booming since June 2020.
However, the current level of new supply is dwarfed by the decade long cumulative undersupply, as shown in the shaded area of the above chart. This is currently providing landlords with excellent pricing power and rent growth.
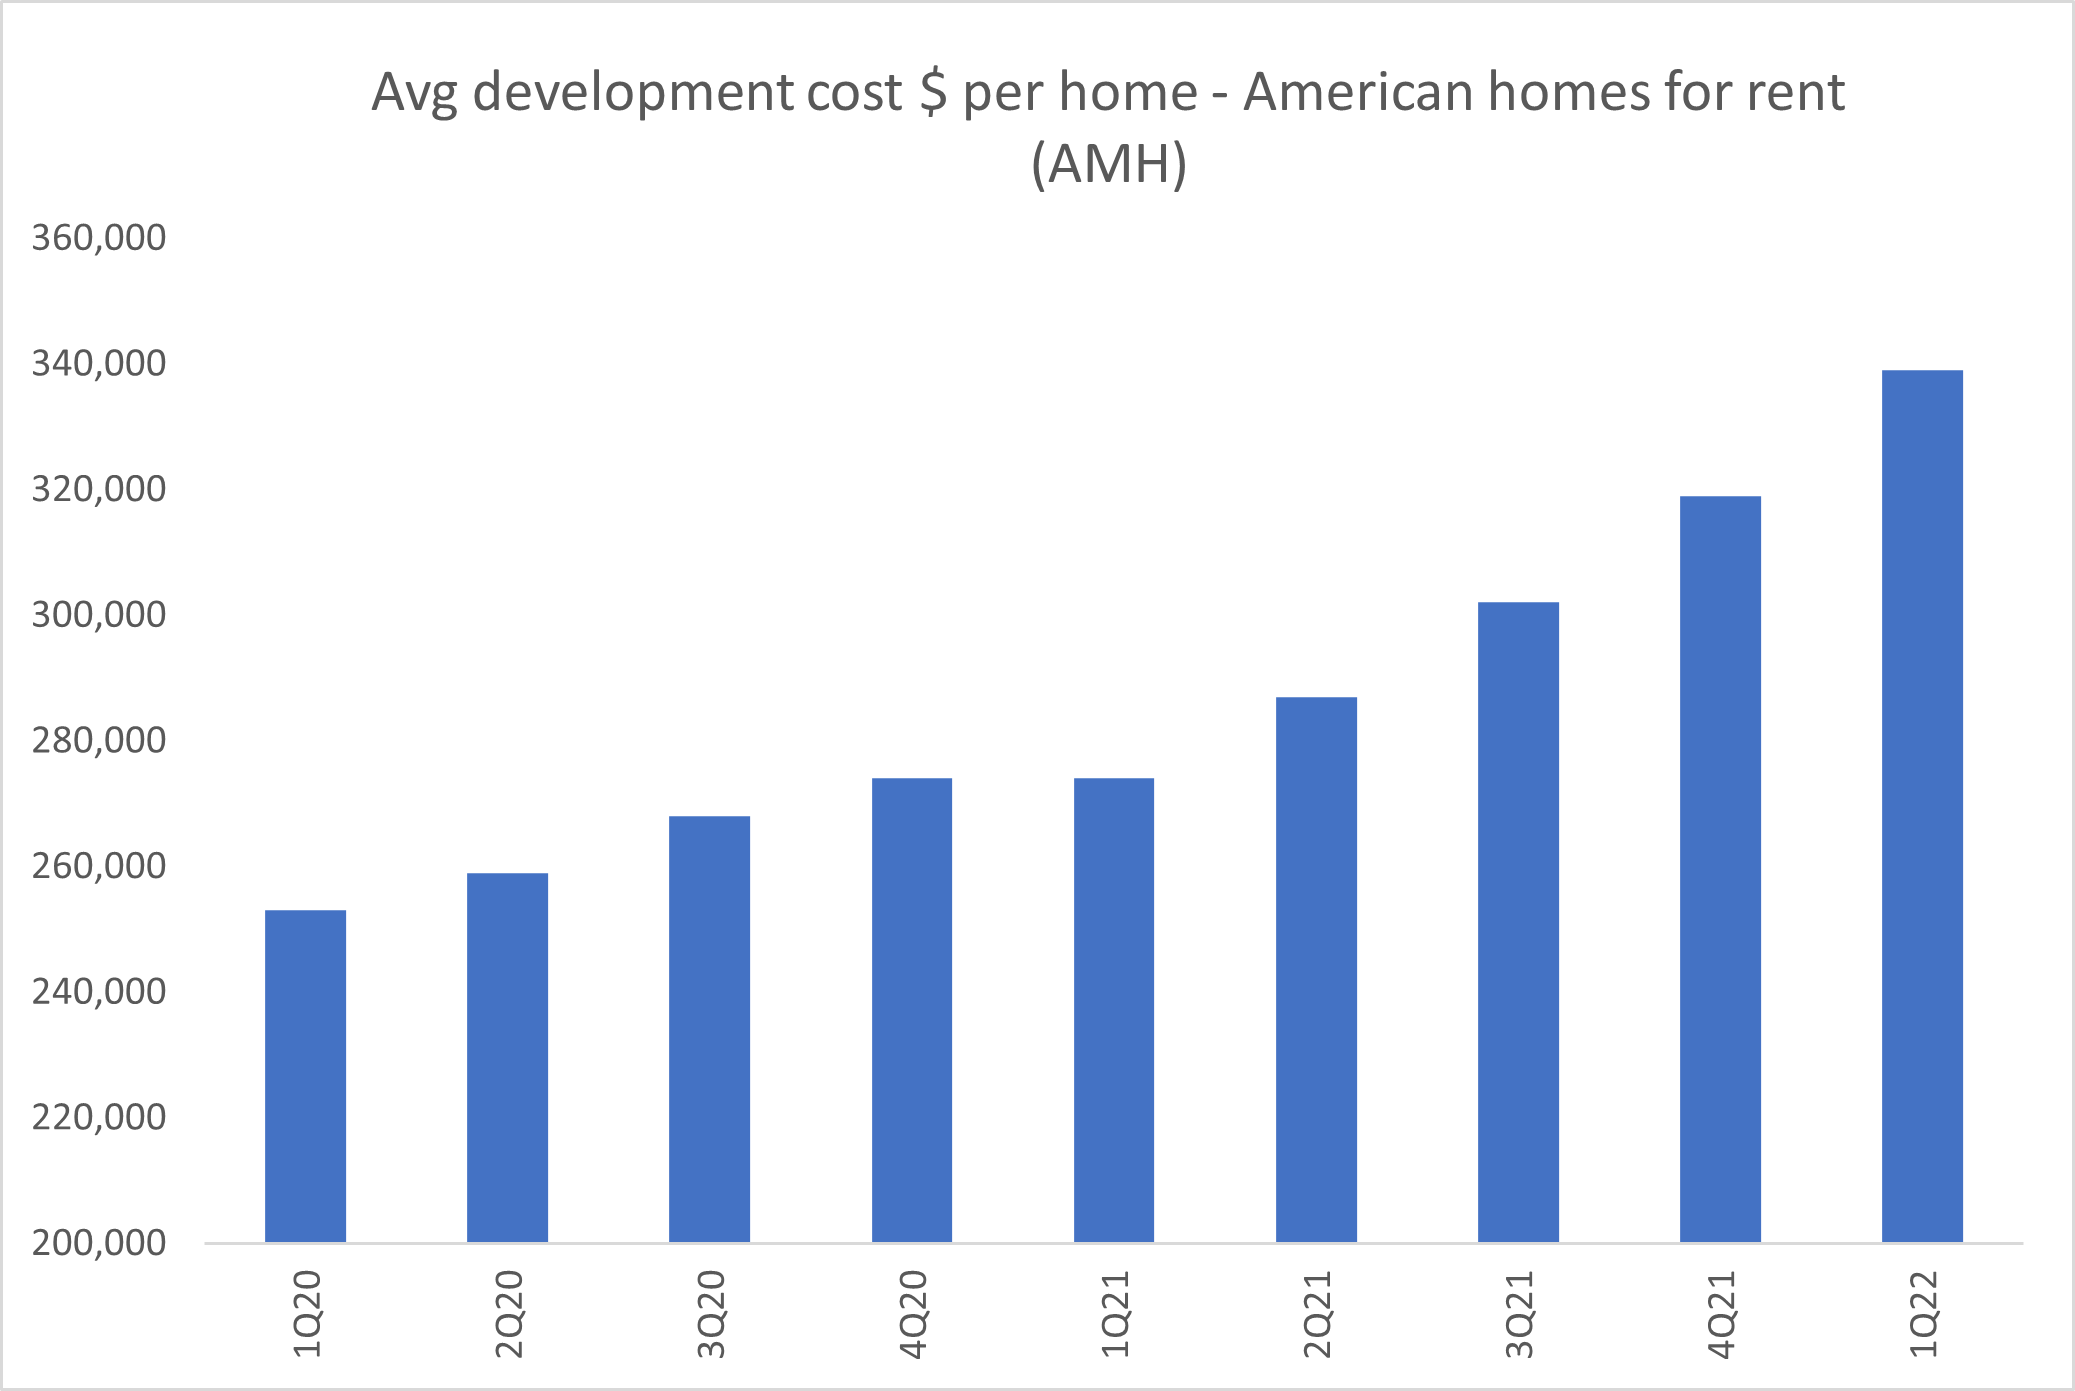
Replacement costs continue to rise, making new supply hard to justify…
Source: Company data, Quay Global Investors
What it means
The core reason real estate is seen as a long-term hedge against inflation is the increase in replacement costs, which makes building new supply at old prices difficult to justify.
The current inflation episode is feeding through to rising replacement values for most forms of real estate, including residential property. With tenant demand surging as economies have re-opened, it’s likely supply will be unable to fully respond in a timely manner due to rising costs (see previous chart). And while landlord pricing power is very strong today, the increasing cost of supply will almost certainly constrain medium-term supply and underpin future capital values.
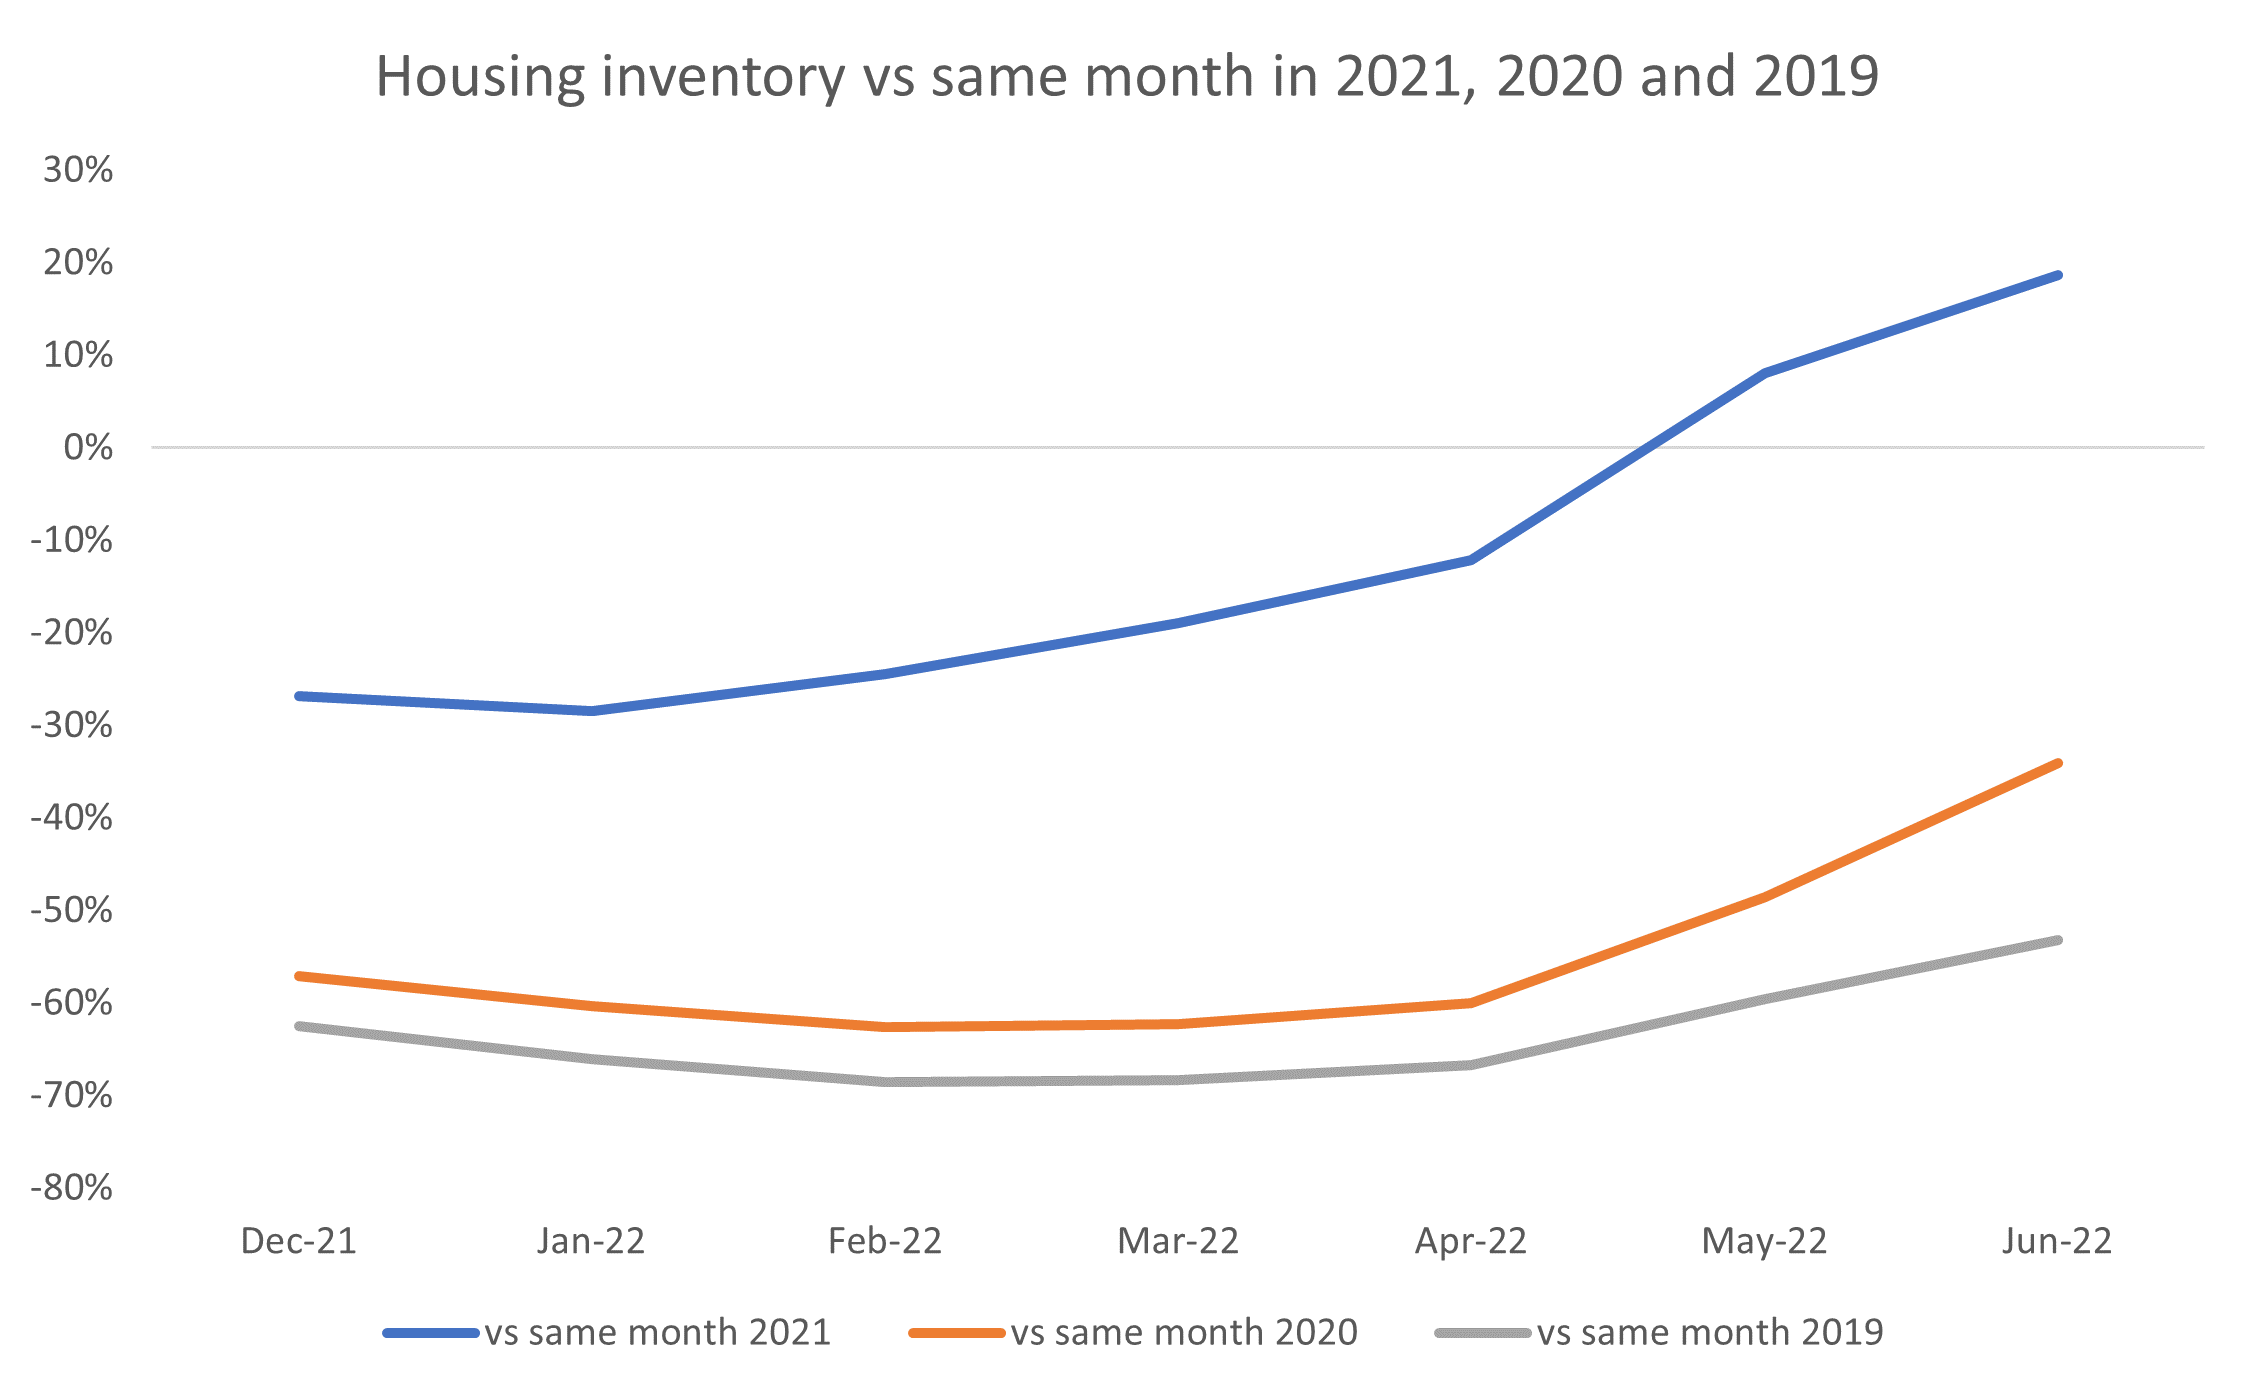
Concern about housing inventory?
Source: BEA, Federal Reserve Bank of St. Louis, Calculated risk, Quay Global Investors
What it means
Market headlines about the increase of housing inventory for sale have revived fears of another GFC-style housing crisis in the US. In our opinion, the above chart shows that this fear appears somewhat overblown.
The chart compares monthly housing inventory for sale this year against the same months in 2021, 2020 and 2019. Yes, housing inventory for sale has increased to above 2021 levels, but it’s still -34% off June 20 levels and -53% of pre-COVID June 19 levels.
Current inventory levels do not appear excessive.
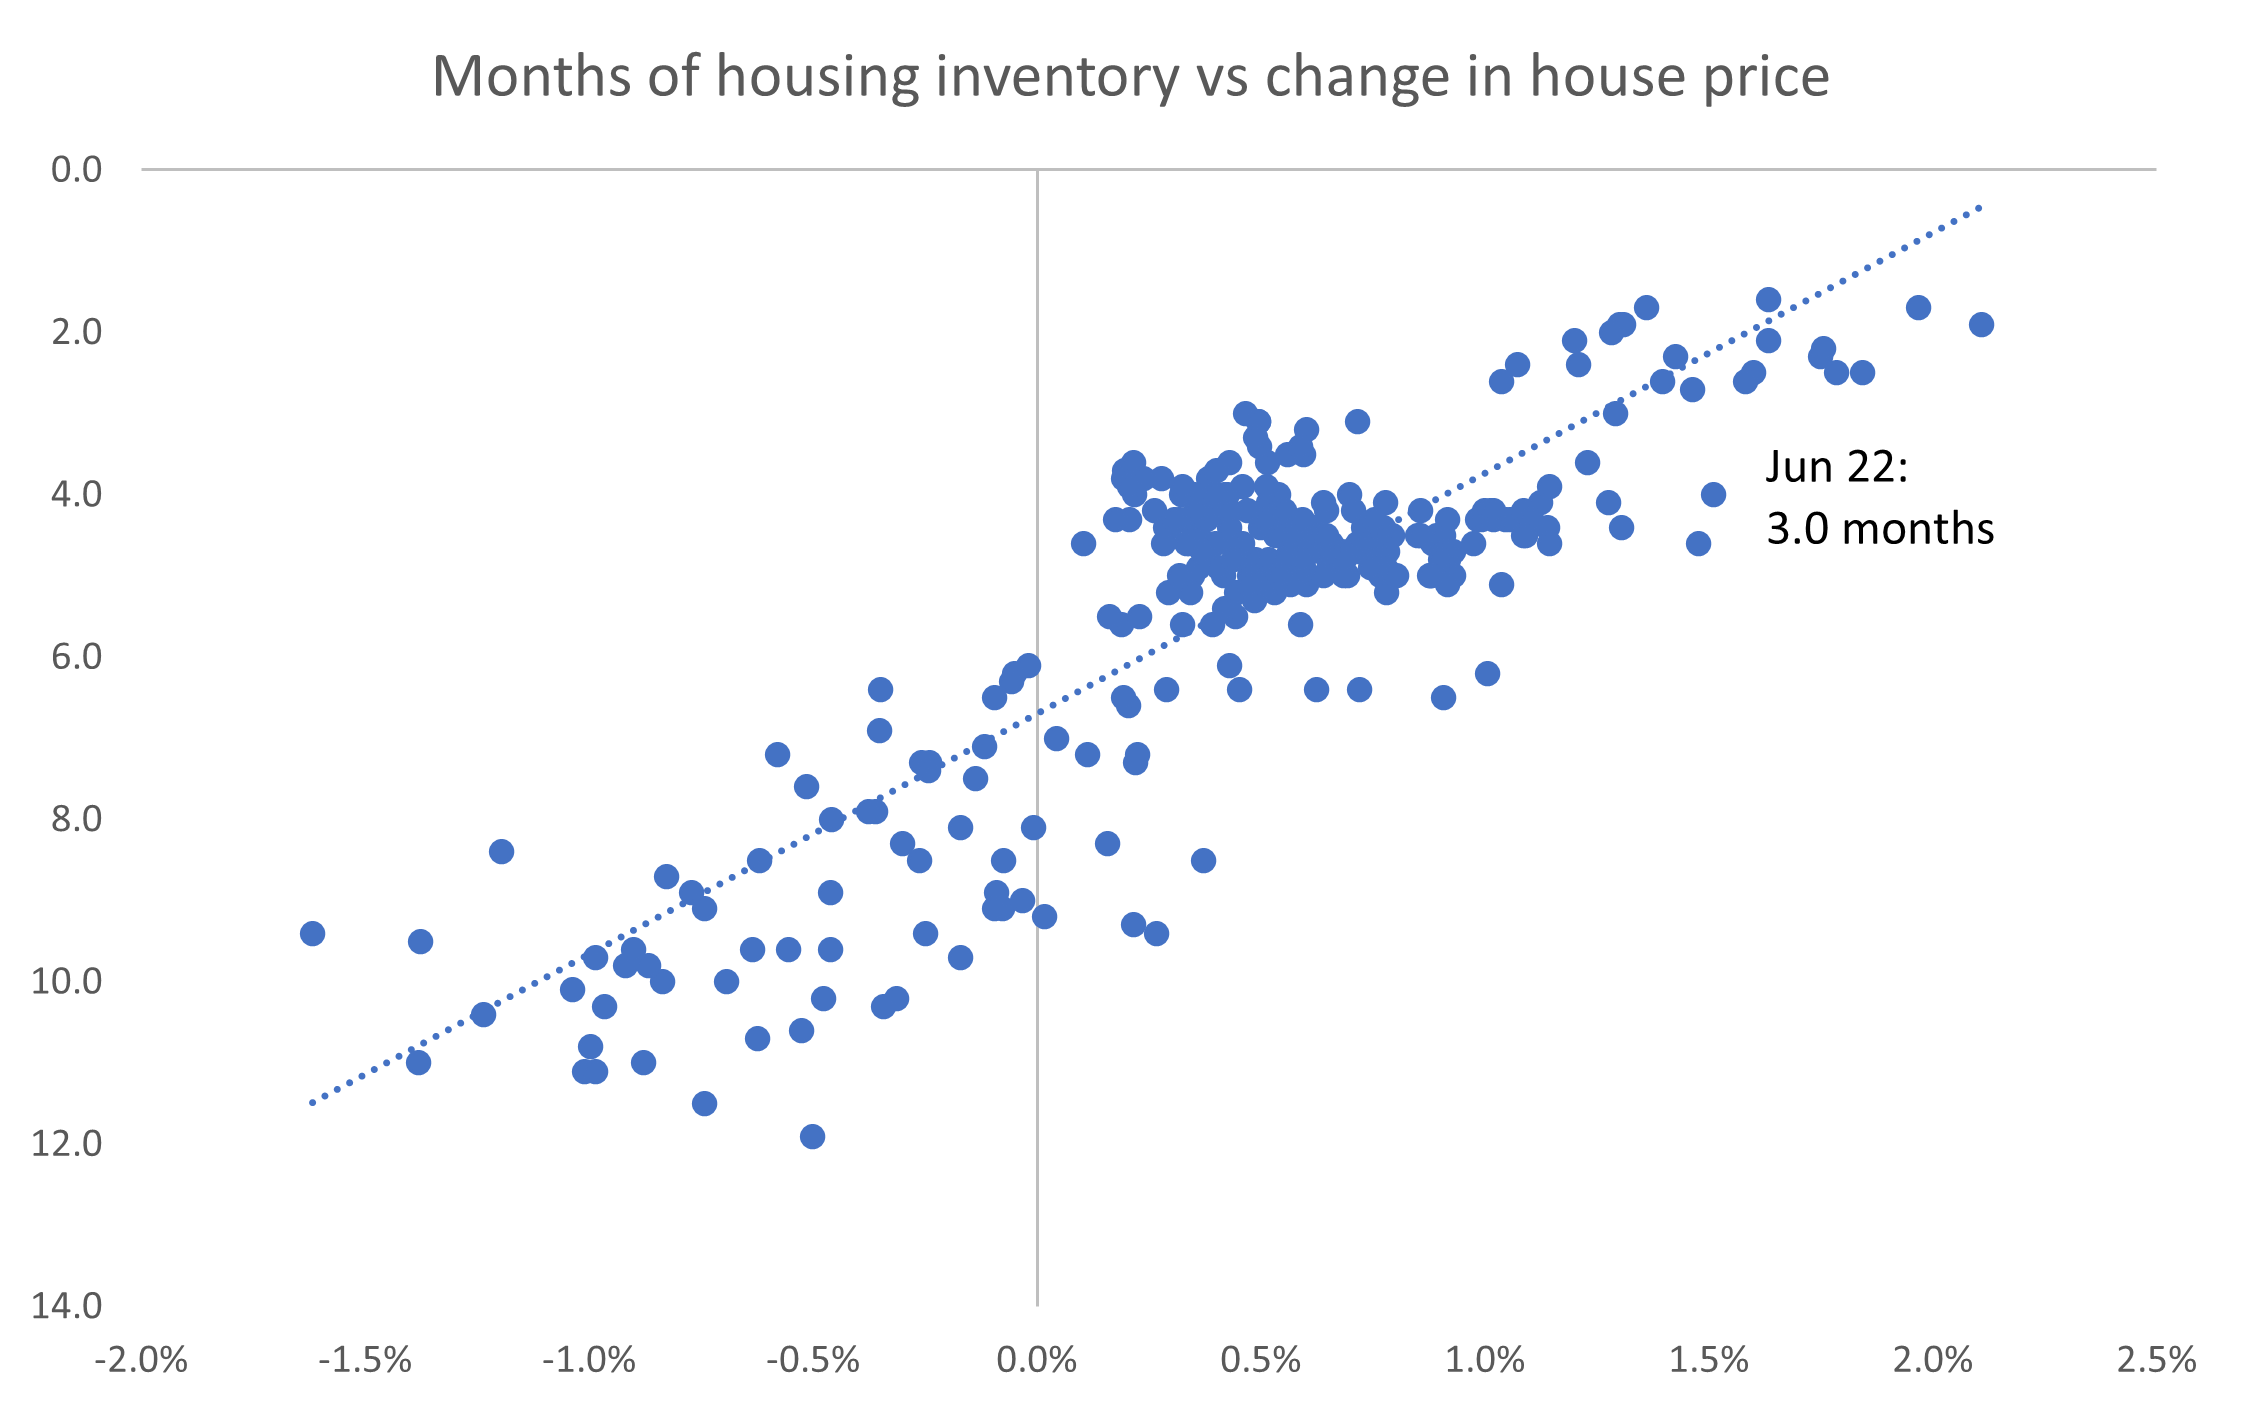
Will rising interest rates crash the US housing market?
Source: Calculated risk, Quay Global Investors, Federal Reserve Bank of St. Louis, National Association of Realtors
What it means
Historical monthly changes in US house prices (Case-Schiller Index, measured on the x-axis) can be largely explained by months of housing inventory for sale (total existing houses for sale divided by average houses sold per month, measured on the y-axis) as depicted in the chart above.
The most recent (June 22) data is currently tracking at 3.0 months inventory supply, which has correlated with 1-2% monthly price increases. Of course, the driver of house prices is much more nuanced than this. However, it’s interesting to note that historically, month-on-month prices have not fallen until monthly housing inventory is above the 6.0 months mark – roughly double where we are today.
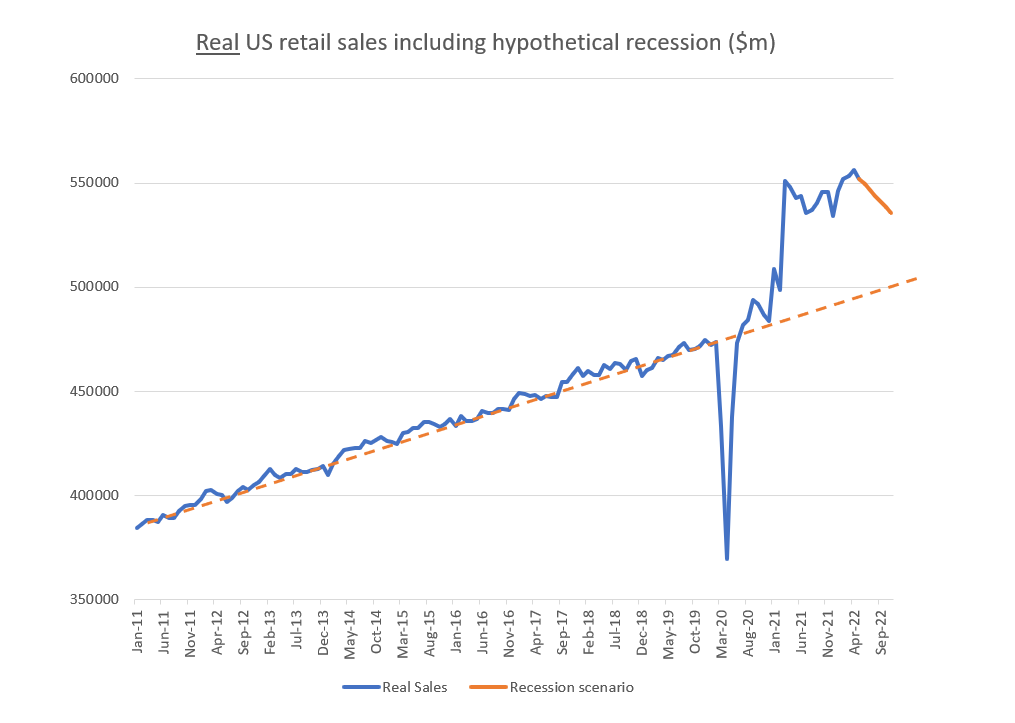
Recession = bad for retail? Maybe not.
Source: Federal Reserve Bank of St. Louis, Quay Global Investors
What it means
Rising interest rates, a slowing economy, talk of recession – these macro stories are enough for investors to avoid anything related to discretionary retail. However, the post-COVID rebound in retail and household consumption has been so great that even a 3% real contraction in sales results in actual volume of sales well above pre-pandemic trends.
The lesson? Rate of change is important, but so too is absolute levels. And even under a scenario of a 3% decline in retail sales volume (represented by the orange line), retailers are still doing well.
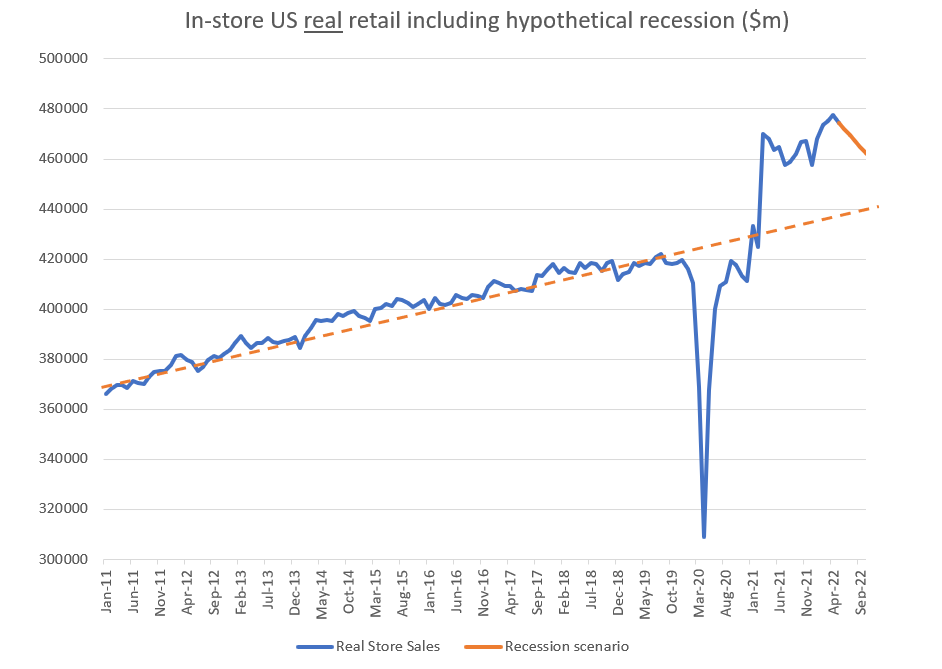
Brick and mortar retail sales well above pre-pandemic trend
Source: Bloomberg, Quay Global Investors
What it means
In-store retail sales have gone from strength-to-strength post-pandemic, despite market predictions about the COVID-accelerated death of brick and mortar retail. Will a recession change the story?
Maybe not.
As with total retail sales, even after allowing for a real 3% decline in sales volume, retail landlords are generating the type of sales volume unimaginable in pre-COVID 2019.
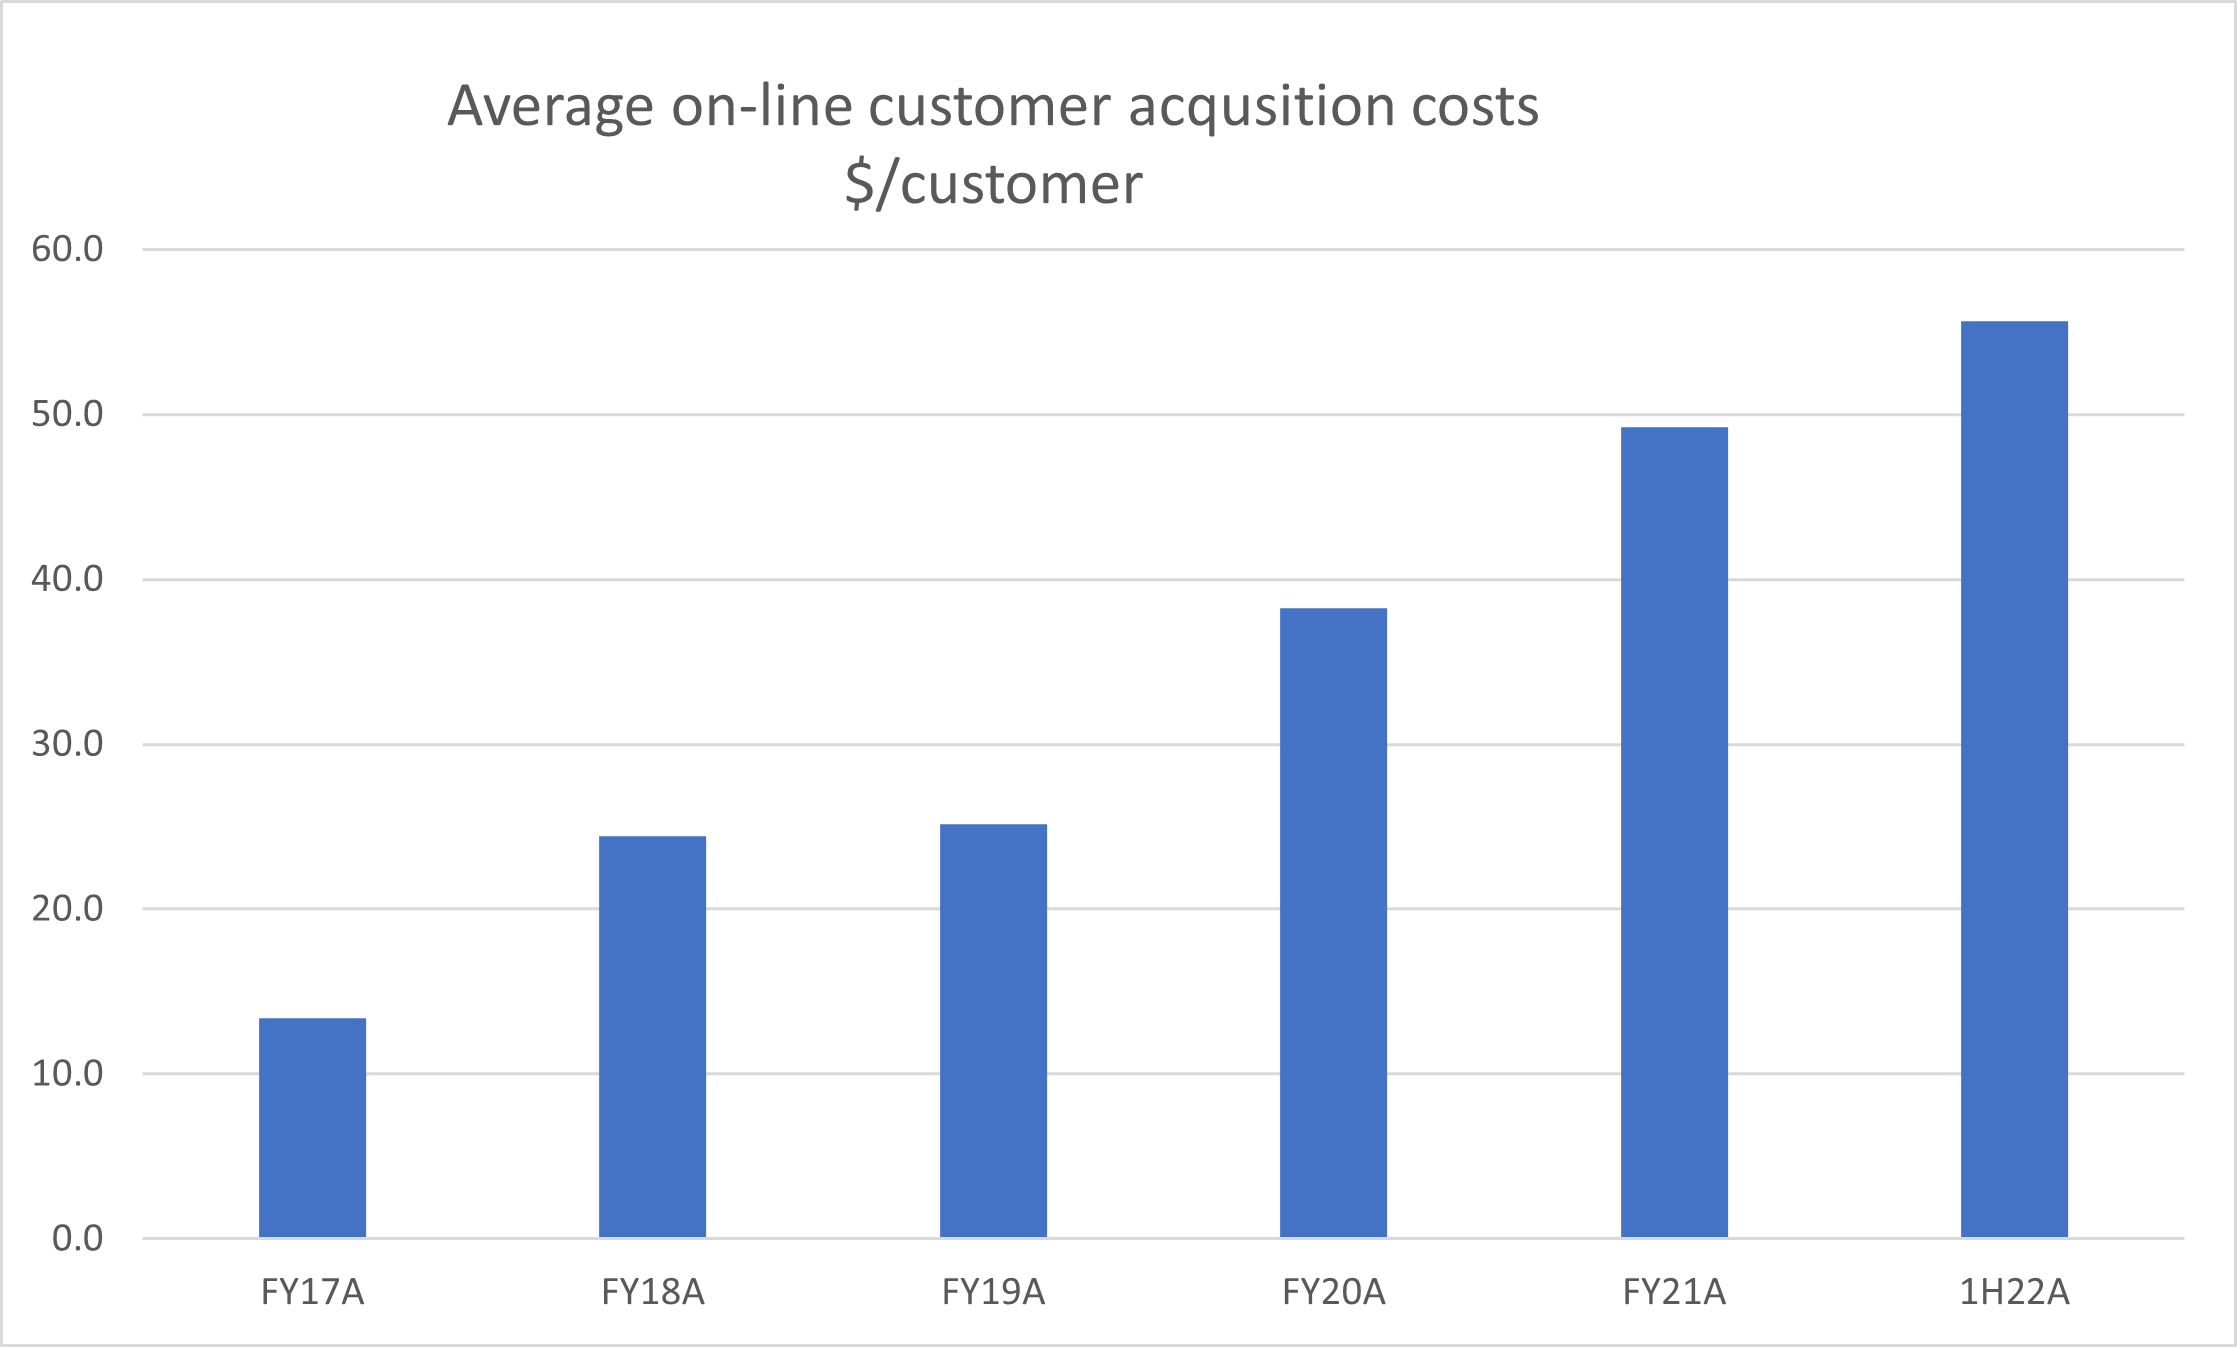
Online retailer customer acquisition costs rising sharply
Source: Jarden, Company Data (includes KGN, TPW, RBL, ABY and CTT)
What it means
Part of the bricks and mortar story can be explained by what’s happening in e-commerce. In a recent letter to employees, Shopify admitted that its expectation for on-line post pandemic growth was disastrously wrong, echoing Amazon’s recent comments.
Part of this could be explained by mean reversion consumer behaviour. However, the data for this chart indicates there could be more to the story. The cost of doing business for online retailers is rising rapidly, as privacy concerns (via online tracking) and search costs rise.
As online costs rise, retailers may be forced to re-think their physical store strategy and halt – or even reverse – store closures, potentially ending the decade-long loss of market share by shopping centre landlords.
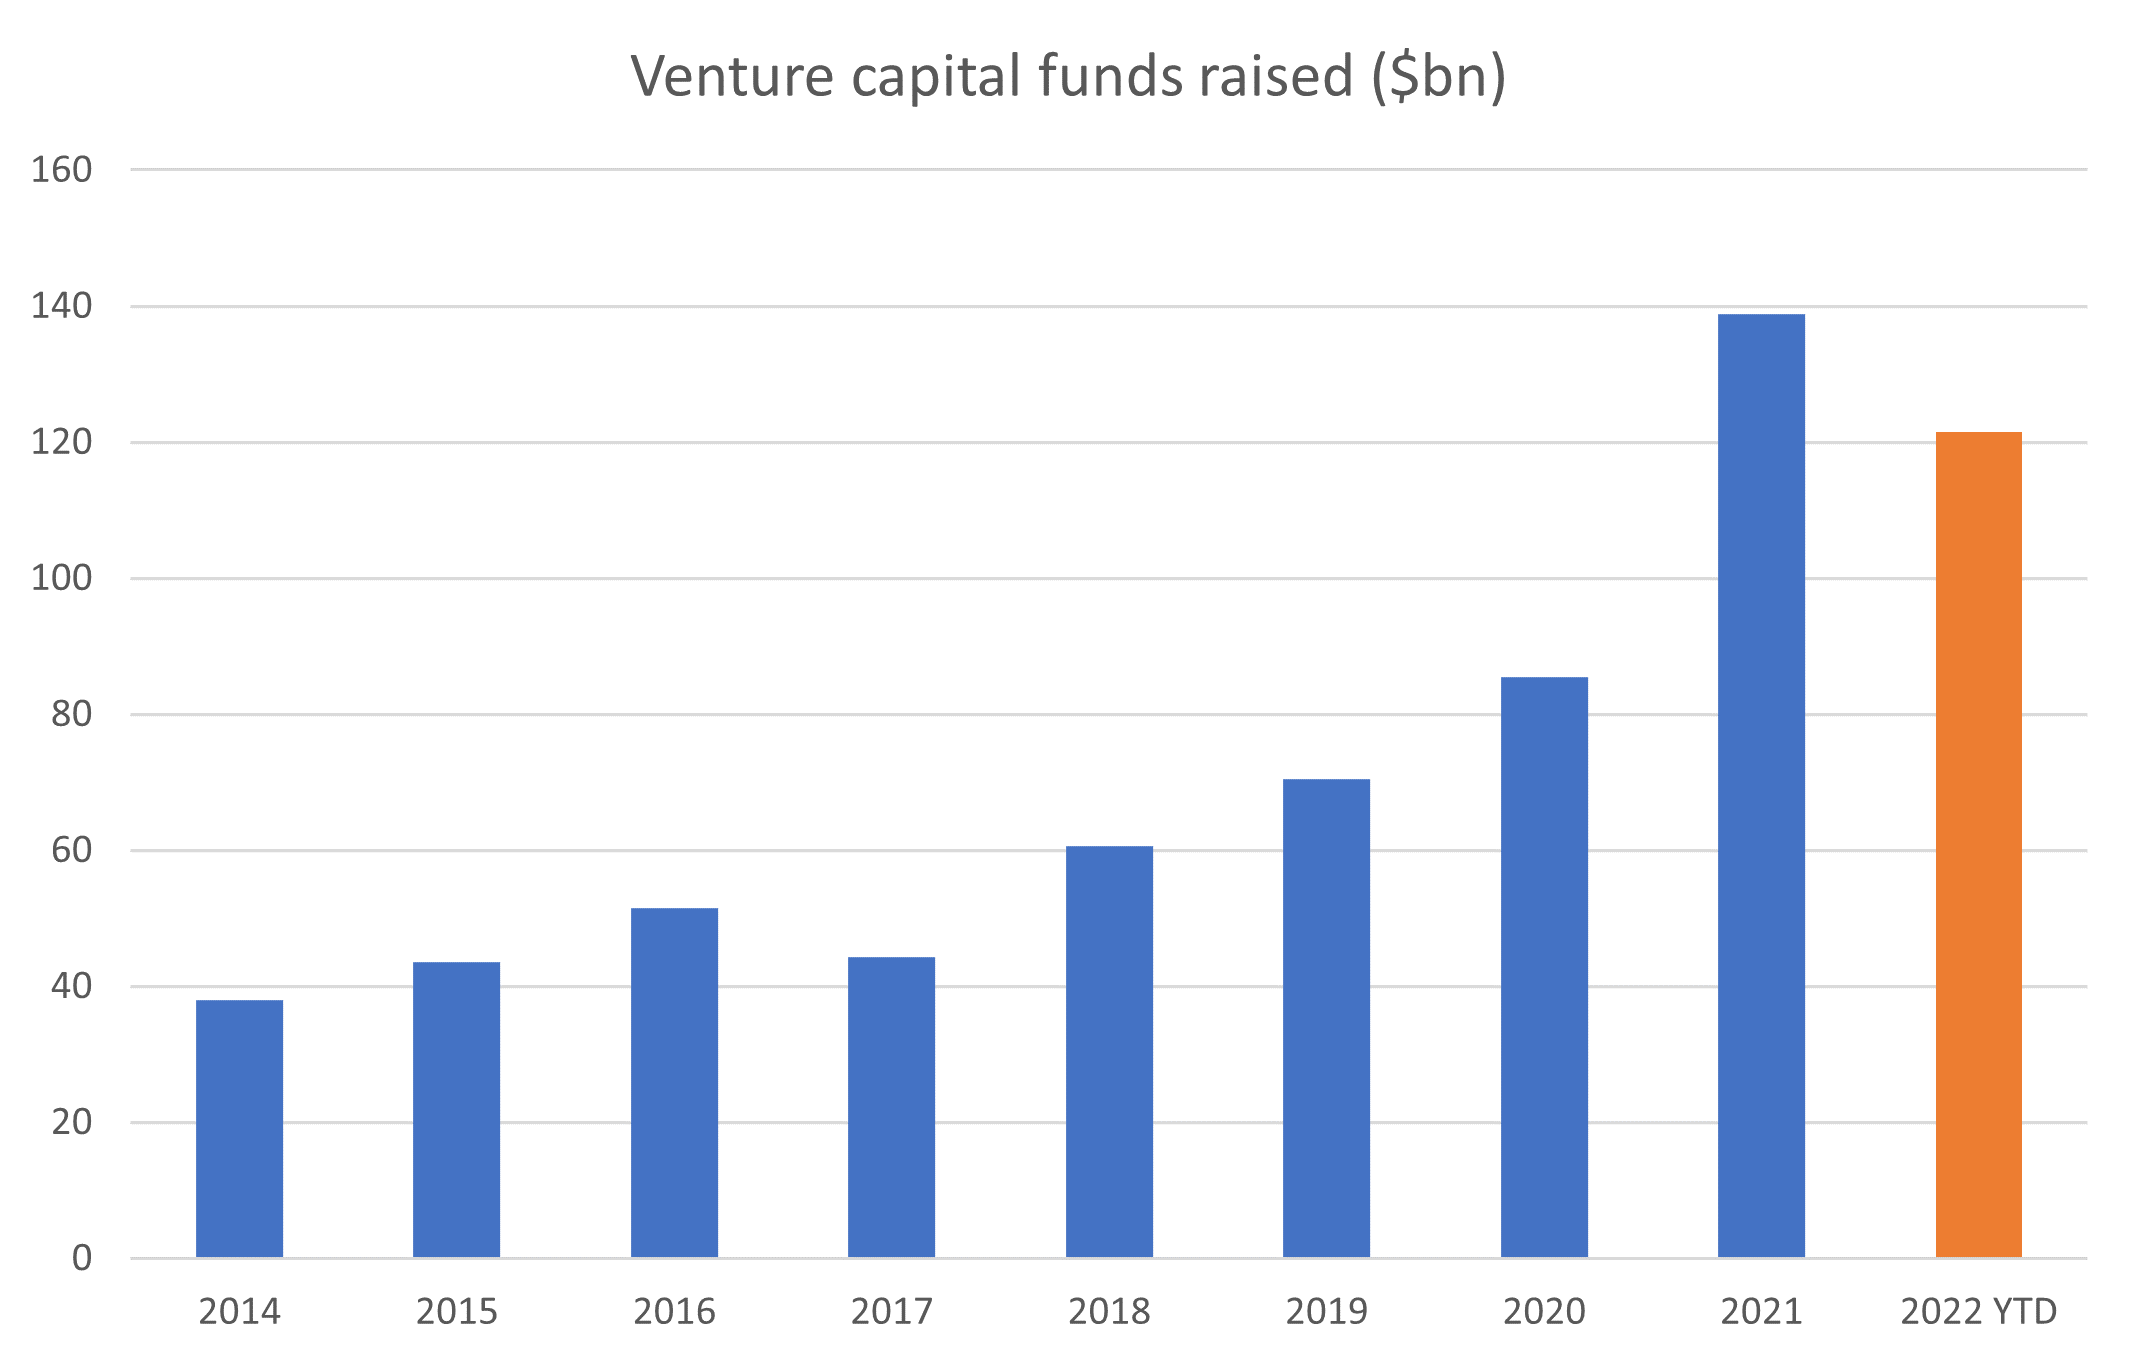
Despite the gloom, venture capital fundraising on track to break record in 2022
Source: KPMG
What it means
It has been a torrid 2022 for tech-related stocks. Hiring freezes or reductions in leading companies, such as Meta, Netflix and Google (Alphabet), have raised concerns of a tech wreck similar to 2001. A knock-on effect is the concern that there will be a new scarcity of venture capital (VC) funding, impacting key industries and related employment.
This is important for real estate due to the real and perceived exposure some sectors have to the tech heavy industries and markets (for example, US West Coast residential and life sciences).
However, the chart above shows investors continue to allocate to VC funds despite the negative headlines. VC funds raised in 2022 (to June) are well on track to break the 2021 record of $139bn. There are no signs of slowdown yet.
Venture capital deals down on last year but still at elevated levels
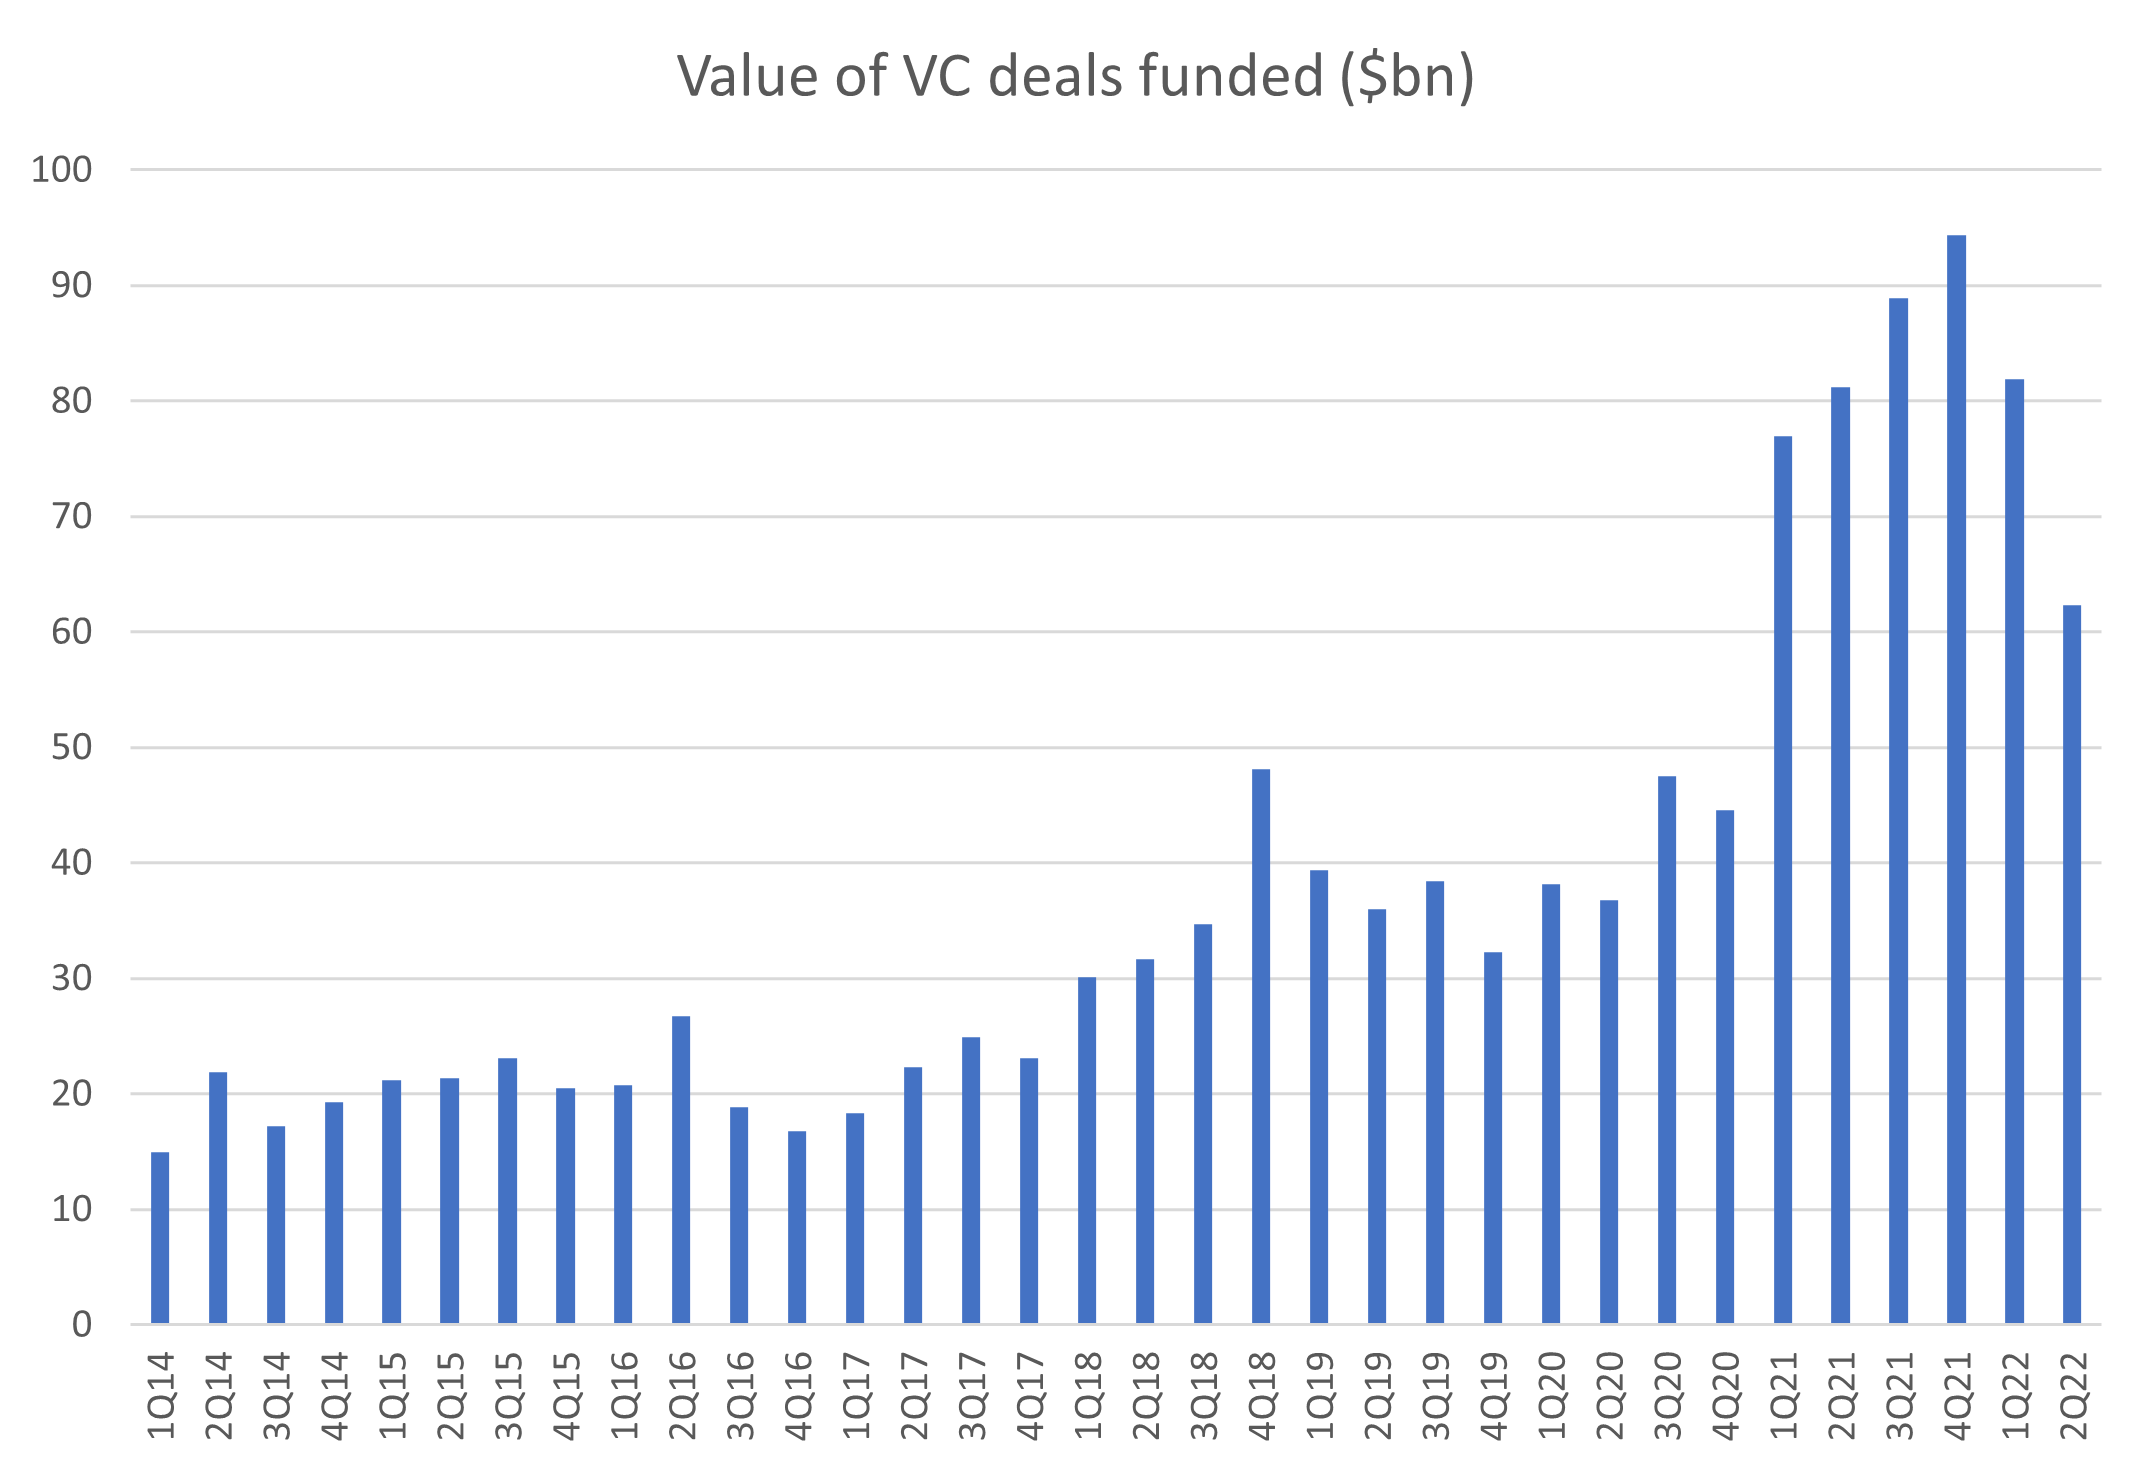
Source: KPMG
What it means
VC deal volumes closed so far this year are much higher than pre-pandemic levels. Given the record fundraising levels shown in the previous chart, this suggests there is a lot of cash in sitting on the sideline. If equity markets stabilise, or turn around from here, VC deals could come back strong.
On a sector level, pharmaceutical and biotech volumes are on track to receive more VC money in 2022 ($20bn) than 2019 ($12bn). This bodes well for our investee, Alexandria Real Estate (ARE US), a life science landlord, which has been sold off -35% YTD based on market concerns about VC funding levels.
If you’re an office bull, you may need to stay patient
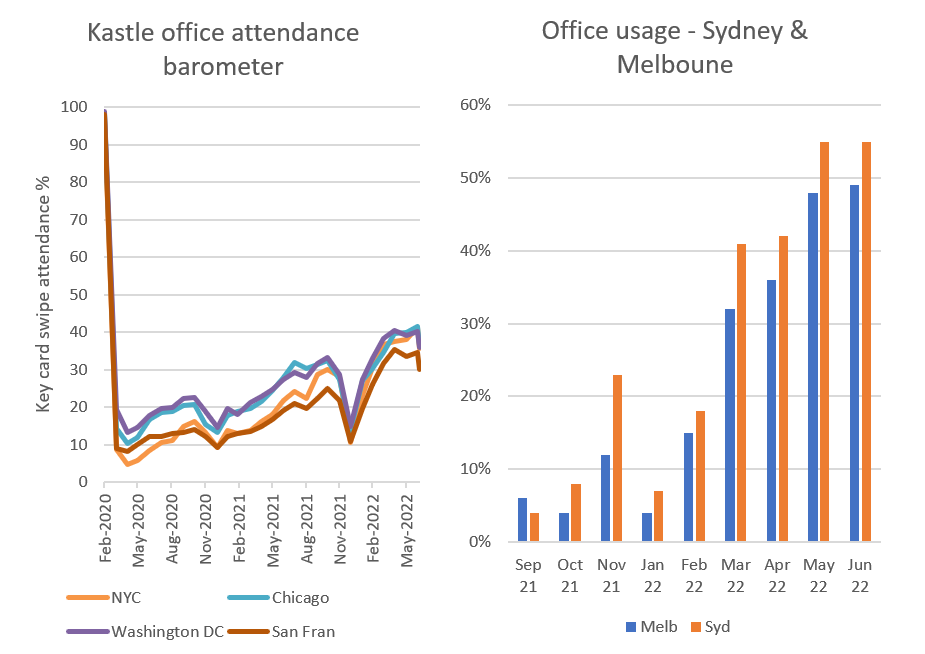
Source: Kastle, Property Council of Australia
What it means
Office attendance in the major job markets in the US and Australia have been increasing, but is still only 30-40% of pre-pandemic levels in the US and roughly 50% in Sydney and Melbourne. Leased office space, however, has not fallen to the same degree (yet). We believe this is due to the fact employers need to factor in scenarios for days where most employees attend the office despite a standing WFH policy. We discussed this in more detail in our article, Thinking about office.
The Quay Global Real Estate Fund invests in a number of global listed real estate companies, groups and funds. The Fund aims to generate a real total return of at least 5% above CPI per annum over a 5+ year investment horizon.
The content contained in this article represents the opinions of the authors. The authors may hold either long or short positions in securities of various companies discussed in the article. This commentary in no way constitutes a solicitation of business or investment advice. It is intended solely as an avenue for the authors to express their personal views on investing and for the entertainment of the reader.

