
In Eric Balchunas’ The Bogle Effect, he recounts the rise of passive investing and ETFs in the US. Balchunas points to the 2008 crash, when the S&P 500 ended up losing about 37 per cent, as being pivotal for passive funds inflows. “If you look at any sell-off period, you’ll typically find that two thirds of managers underperform their benchmark – about the same as in most other one year periods or any market conditions,” he says. This is contrary to active managers’ regular claim that they outperform in a downturn. Like the Emperor from the old fairy tale and his non-existent outfit, the evidence is different from the belief.
According to Jack Bogle, who is referred to as the father of index investing, “Before costs, beating the market is a zero-sum game. After costs, it is a loser’s game.” It is because of this that many investors prefer the certainty of index-like returns, hence the rise of passive investing. Certainty is the key word.
Actively managed funds, which charge higher fees than passive funds, give investors uncertain outcomes. Sometimes the outcomes are good, but often they are note. Many people find this a poor bargain and have started moving to lower cost passive funds. The most popular of which, track traditional indices such as the S&P 500. In these passive funds, returns could be thought of as average – not high, not low, just the market average. These returns however are more certain compared to the active fund, where it is unknown whether they will outperform or underperform the traditional index during any given market condition.
The idea of certainty is important to investors and their advisers, but it is in contrast with the outcomes of active management. It is near impossible to predict returns and it is near impossible to predict the winning fund manager.
As shown repeatedly in the S&P Indices Versus Active (SPIVA) scorecards, active managers have a difficult time in both rising and falling markets. Active managers consistently underperform, and generally, the longer the timeframe, the more they struggle.
Table 1: Percentage of funds outperformed by the index
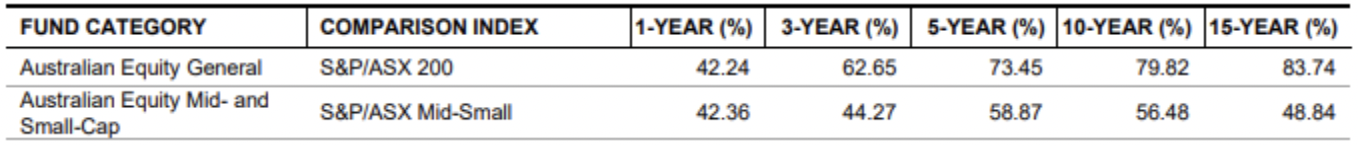
Source: S&P Dow Jones Indices LLC, Morningstar. Data as of 31 December 2021. Past performance is no guarantee of future results. Table is provided for illustrative purposes and reflects hypothetical historical performance. Please see the Performance Disclosure at the end of this document for more information regarding the inherent limitations associated with back-tested performance
Persistency is also an issue. The last year’s winner is not necessarily going to be the best manager in the following year. S&P also produce a Persistency Scorecard, with the intention of revealing fund managers’ skills in different market environments. In the most recent persistence report, according to S&P, “Out of the 81 top-performing Australian Equity General Funds, only three of them (3.7%) consistently remained in the top quartile in the following two consecutive 12-month periods.” You can see in small companies only 12.9% stayed in the top quartile. Over five consecutive 12 month periods, the number drops to zero for Australian Equity Managers and 3.4% for small companies.
Table 2: Performance persistence of Australian active funds over three consecutive 12-month periods: (June 2018-June 2021)
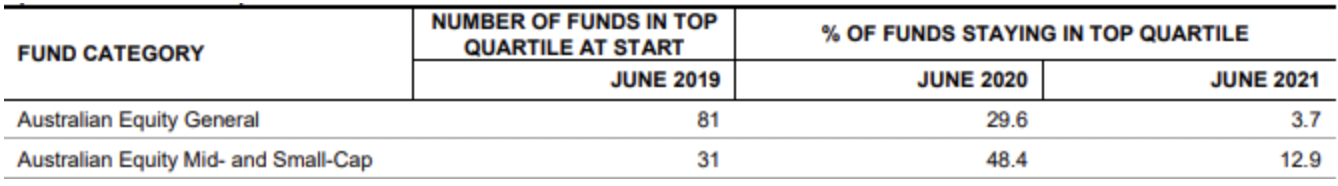
Source: S&P Dow Jones Indices LLC, Morningstar. Data as of 30 June 2021. The fund returns used in the analysis are net of fees, excluding loads. Table is provided for illustrative purposes. Past performance is no guarantee of future results.
Table 3: Performance persistence of Australian active funds over five consecutive 12-month periods: (June 2016-June 2021)
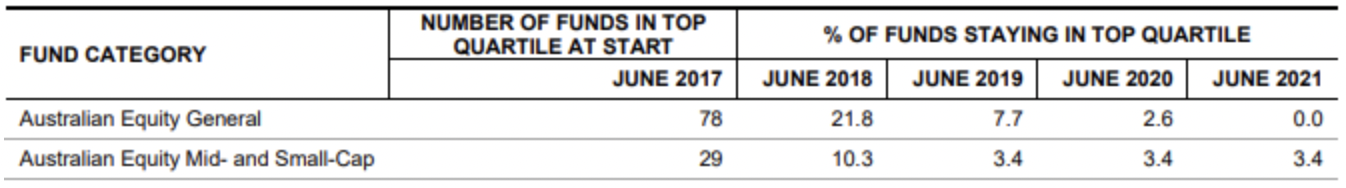
Source: S&P Dow Jones Indices LLC, Morningstar. Data as of 30 June 2021. The fund returns used in the analysis are net of fees, excluding loads. Table is provided for illustrative purposes. Past performance is no guarantee of future results.
So far, Australia has been slower in the shift from active to passive managers than the US, which sped up following the 2008 GFC (global financial crisis). We think the current ‘bear’ market may provide the impetus for Australian investors to look beyond active managers with the goal of achieving more certain returns for less fees.
However, we do not think the look for certainty is restricted to passive funds tracking traditional indices like the S&P/ASX 200 Index or the S&P/ASX Small Ordinaries Index. Rather, investors will also gravitate to ETFs that track indices with proven track records through different market conditions.
These indices are known as smart beta indices and they retain the benefits of passive management being low costs and transparent, but with the potential to provide a different outcome than the traditional market index, an outcome that should be explainable, that is more certain.
As an example, VanEck has low-cost smart beta strategies in Australian equities and Australian Small Companies. We believe these offer more certain, or explainable, performance than active managers trying to outperform the S&P/ASX 200 Index or the S&P/ASX Small Ordinaries Index because they track well-constructed indices, based on rigorous research. To learn more about assessing an index – click here.
Australian equities
The VanEck Australian Equal Weight ETF (MVW) tracks the MVIS Australia Equal Weight Index (MVW Index). Equal weighting is supported by academic research including by Australia’s CSIRO and Monash University. They found equal weighting outperforms the standard market cap approach over the long term because:
- Smaller companies historically outperform large caps on average over the long term;
- It has higher exposure to so-called ‘value’ companies; and
- Has better market timing
What this means is that equal weighting historically outperforms during periods of expansion. This is the third point raised in the independent research regarding market timing. As you can see below, the equal weighted index outperformed between the end of the dot com period and in the lead up to the GFC, post the GFC and post the Greek debt crisis.
It’s also worth noting that equal weighting underperformed during the GFC and 2020 COVID-19 market drawdown, during both downturns, there was a greater demand for the mega-caps.
However, over the long term, equal weighting has outperformed. However, it is important to note that past performance is by no means a reliable indicator of future performance.
Chart 1: MVW Index performance:
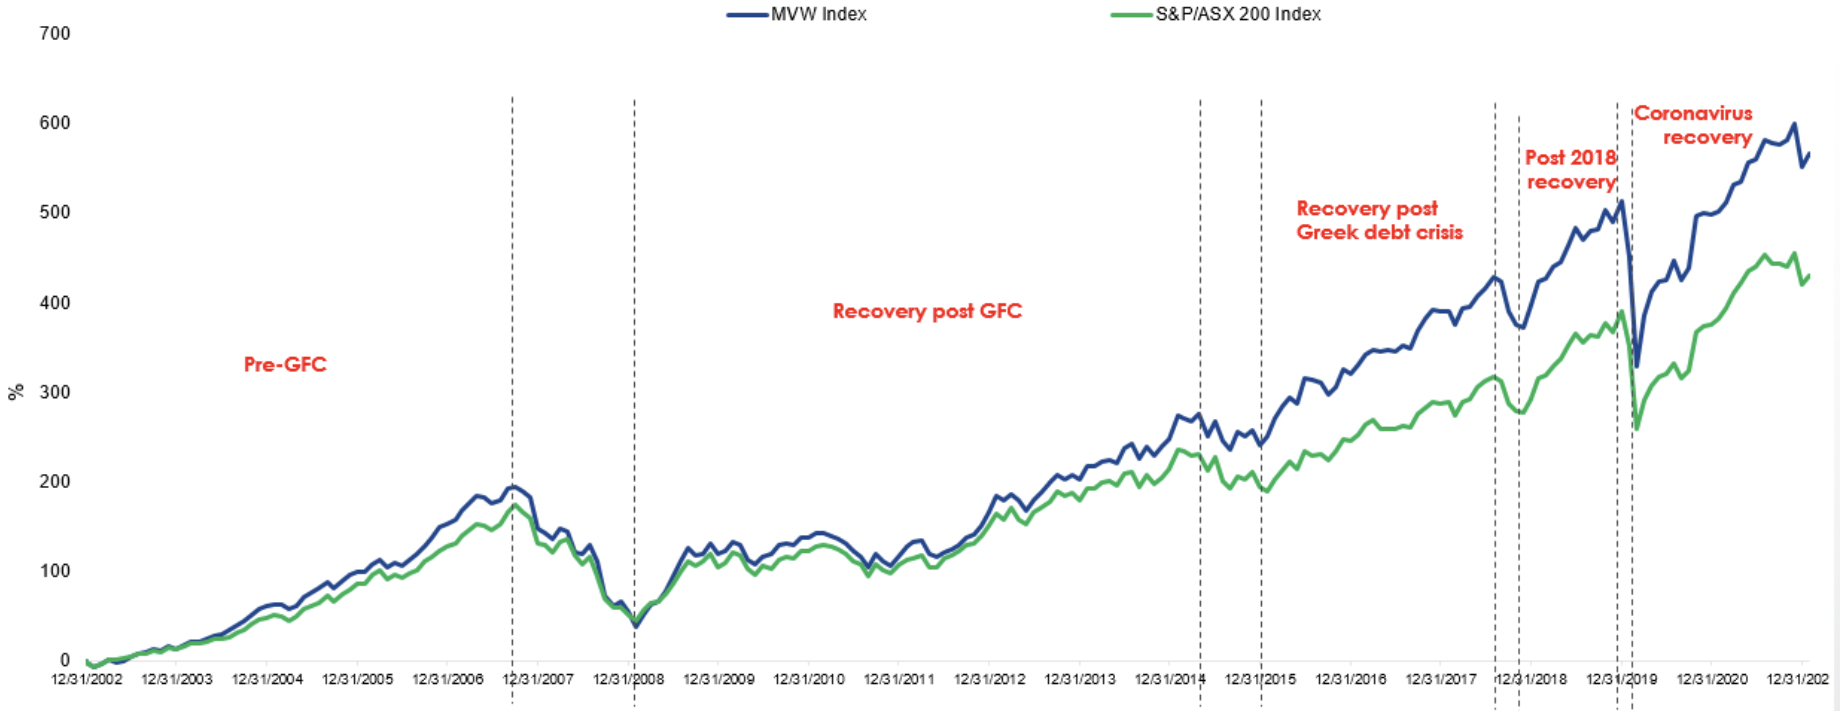
Source: Morningstar Direct as at 30 April 2022. Performance shown of the MVW Index prior to its launch date is simulated based on the current index methodology. Results assume immediate reinvestment of all dividends and exclude costs associated with investing in the ETF and taxes. You cannot invest directly in an index. Past performance is not a reliable indicator of future performance of the MVW Index or MVW.The S&P/ASX Small Ordinaries Index (“Small Ords”) is shown for comparison purposes as it is the widely recognised benchmark used to measure the performance of the 200 ASX-listed companies included in the S&P/ASX 300 but not in the S&P/ASX 100, weighted by market capitalisation. MVS’s index measures the performance of a portfolio of dividend paying small-cap companies, with a maximum weighting of 8%. It has fewer securities and different industry allocations than the Small Ords. ‘Click here for more details’
Australian Small Companies
The VanEck Small Companies Masters ETF (MVS) tracks the MVIS Australia Small-Cap Dividend Payers Index (MVS Index) that only includes liquid, dividend paying companies. Research has shown that MVS Index’s outperformance, relative to the S&P/ASX Small Ordinaries Index is the result of its dividend filter, which produces a portfolio that:
- has a value and a quality tilt,
- provides exposure to stocks with low volatility, and
- avoids the problem of positive skew.
Quality and value investing are time-tested investment approaches that have been upheld by investment gurus such as Buffett and Munger.
In past ‘value’ markets (where the blue column is above zero), similar to the one we are currently experiencing, MVS Index’s approach has outperformed (where the orange column is greater than zero). Again, it is important to note that past performance is by no means a reliable indicator of future performance.
Chart 4: Annual returns: MVS Index vs Small Ords, Value less Growth
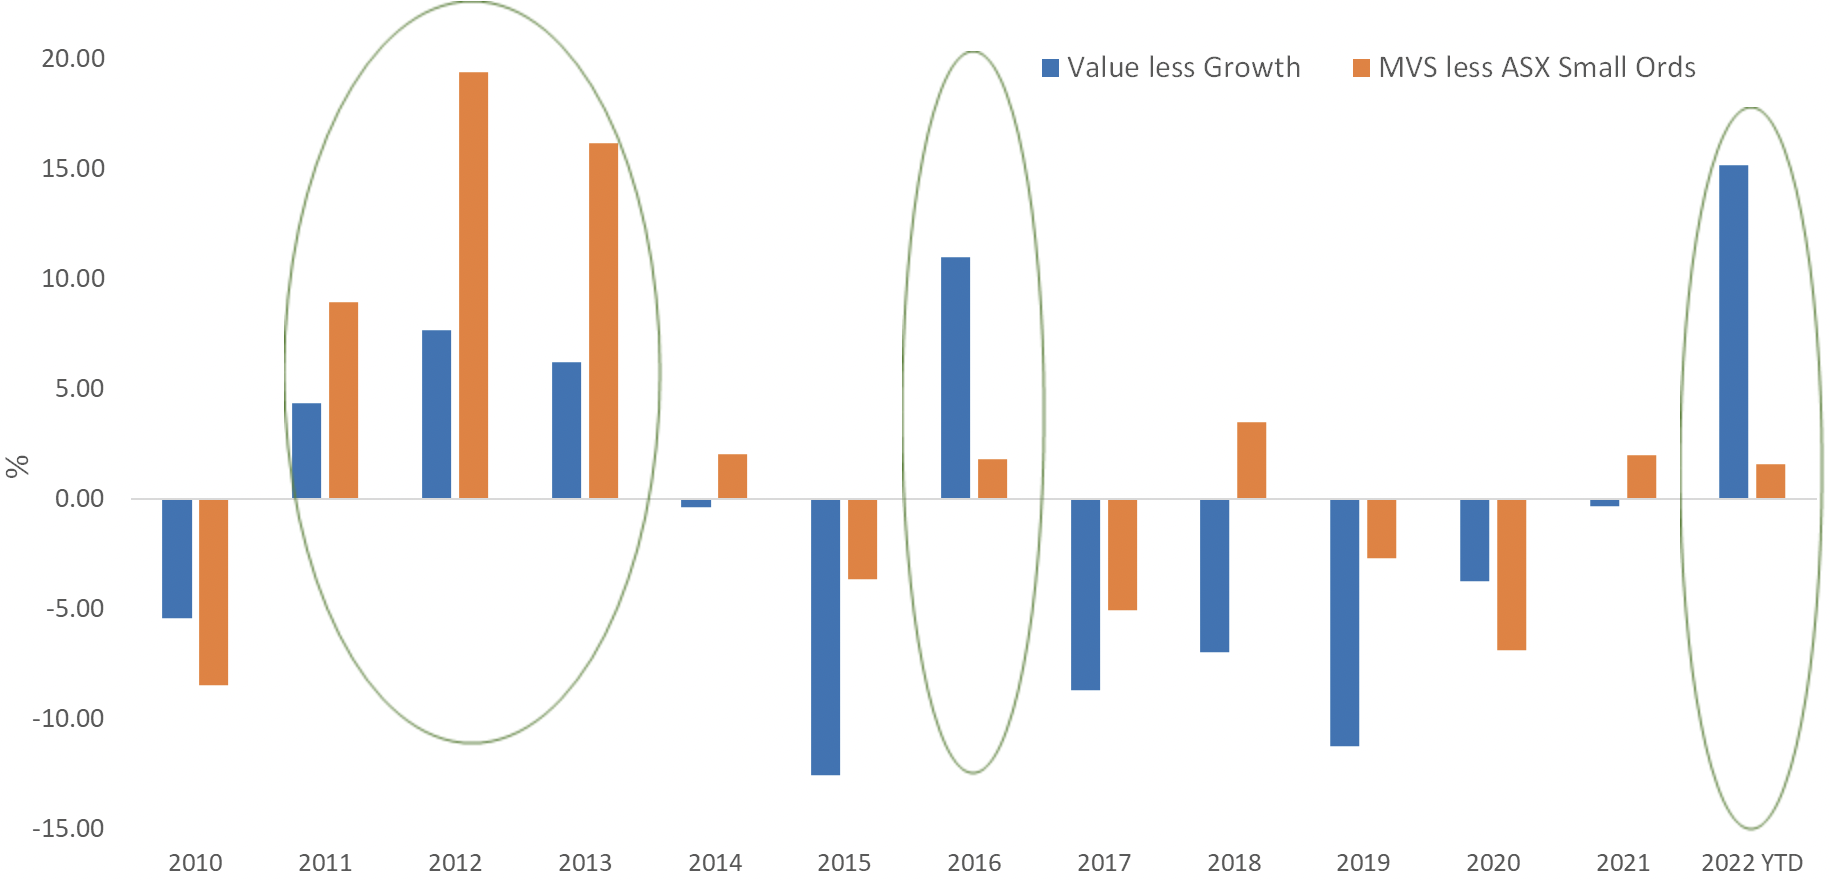
Source: Morningstar Direct as at 24 May 2022. Performance shown of the MVS Index prior to its launch date is simulated based on the current index methodology. Results assume immediate reinvestment of all dividends and exclude costs associated with investing in the ETF and taxes. You cannot invest directly in an index. Past performance is not a reliable indicator of future performance of the MVS Index or MVS.The S&P/ASX Small Ordinaries Index (“Small Ords”) is shown for comparison purposes as it is the widely recognised benchmark used to measure the performance of the 200 ASX-listed companies included in the S&P/ASX 300 but not in the S&P/ASX 100, weighted by market capitalisation. MVS’s index measures the performance of a portfolio of dividend paying small-cap companies, with a maximum weighting of 8%. It has fewer securities and different industry allocations than the Small Ords. ‘Click here for more details’
The only thing certain is the rise of passive. The question is, are you wearing the right clothes?

