
In the last Vector Insights, we highlighted the volatility of bond prices in 2022. As bond prices fall, we explained, yields rise. But what are investors actually getting? ‘Yield’ is quoted many ways.
The following is intended to help explain yield, with a view to help.
…………
Investors use assets like bonds in their portfolios to enhance income and compliment low risk interest-paying investments such as cash and term deposits.
A bond is essentially a loan by an investor to the entity issuing the bond. The entity could be the Commonwealth Government of Australia, the State Government of New South Wales or a company like ANZ.
In return for the loan, the entity makes a promise, that is, it “gives its bond”, that it will repay the loan on a specified date (the maturity date) and it will make interest payments at regular intervals during the term of the loan.
Bonds are issued at a particular face value or principal, with a specified interest rate, called the coupon rate. Like a term deposit, the longer the term of the bond, generally the higher the coupon rate on the investment; investors are rewarded for locking up their money for longer.
Coupons
Similar to a loan, a bond is issued for a specific term or maturity. This generally ranges from 12 months to 30 years. Most bonds have a fixed coupon which is paid periodically to investors (often monthly or quarterly) from the time the bond is issued through to its maturity.
As an example, a bond might be issued with a face value of $100 and a 7% fixed coupon and a term to maturity of 2 years. This means the bond will pay investors a $7 coupon each year over the life of the bond. At the maturity date, the issuer has an obligation to repay the $100 principal plus the final $7 coupon to the bond holder.
A bond’s coupon reflects:
- The bond’s term to maturity;
- Prevailing market interest rates at the time the bond is issued; and
- The issuer’s creditworthiness.
The coupon is different from the bond’s ‘yield’. There are various ways to calculate ‘yield’ and this can be very confusing. There are two commonly used yield measures, yield to maturity and running yield.
Coupon on floating rate bonds
Some corporate bonds pay a floating coupon rate, which can vary over the bond’s term. The coupon is typically calculated as a set margin above a recognised short-term market interest rate. For example, the coupon rate on FRNs is often stated as “the 3-month bank bill swap rate + 1%” or “3mth BBSW + 1%”. FRN coupon rates are typically reset every 3 months based on the prevailing market interest rate. This means coupon payments will increase if market interest rates rise, or fall if rates go down.
Yield to maturity
Yield to maturity is the rate of return earned by an investor who buys the bond today at the market price. This measure assumes the investor will hold the bond until maturity and receives all the coupons payments and the principal repayment on schedule.
Running yield
The running yield is a calculation that divides the annual income expected to be received by the investor by the bond’s current market value.
The running yield will be higher than the yield to maturity if the market value of the bond is higher than its original face value and vice versa.
Yield to call
You may also see the term yield to call, which is similar to yield to maturity. Yield to call is the industry standard for comparing yields for hybrid-type securities like subordinated debt, ASX listed hybrids and capital securities.
These bonds are ‘callable’ bonds, which means the bond issuer can ‘call’ them prior to maturity. Yield to call refers to the return an investor receives if the bond is held until its earliest call date.
Comparison of yield to maturity and running yield
The example below shows the different results of the two measures:
A bond has an annual coupon rate of 7% ($7).
The bond has a face value of $100 and has one month to go until maturity. Only the final coupon and principal payment remain to be made.
The market value of the bond is currently $106.90. This is marginally less than the face value of $100 plus the final coupon payment ($7).
Yield to maturity equals
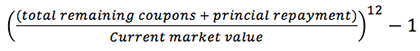
Running yield equals
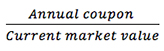
In this example, the running yield is not a fair representation of the anticipated return on a bond investment. Investors should instead use the yield to maturity that represents the actual return earned.
When it comes to running yield comparisons, we would always recommend caution. The measure itself is not widely used by institutional fixed income practitioners, as it can be misleading because it does not show the full picture. The measure only reflects the income and not the capital gain/loss at maturity, which depends on the price paid for the bond.
The yield of an ETF
A convenient way to invest in bonds is via an exchange traded fund (ETF). ETFs are managed funds that trade on the ASX just like shares, so some of the jargon used in share investing applies to ETFs. ETF investors may also be interested in the ‘dividend yield’ of their ETF.
Dividend yield of the ETF
A dividend yield measures the historical cash flow paid by an ETF based on the current price of the ETF. The dividend yield is calculated by adding up the distributions paid in the past twelve months and dividing it by the current net asset value (NAV) of the ETF.
Now you have a licence to compare yields.
Below are the yield metrics for VanEck’s bond ETFs as at the most recent month end.
PLUS: VanEck Australian Corporate Bond Plus ETF (ASX: PLUS)
PLUS tracks the iBoxx AUD Corporates Yield Plus Mid Price Index and is a portfolio of the highest yielding investment grade AUD corporate bonds.
|
PLUS yield statistics
|
|
|
Yield to maturity
|
4.74%
|
|
Running yield
|
3.49%
|
|
Dividend yield
|
1.99%
|
All figures as at 30 April 2022. Yield figured quoted do not account for fees or taxes. Yield figures quoted are not a forecast, and are not a guarantee of, the future return of the fund that will vary from time to time. Past performance is not a reliable indicator of future performance.
FLOT: VanEck Australian Floating Rate ETF (ASX: FLOT)
FLOT tracks the market benchmark for all Australian floating rate notes (FRNs), the Bloomberg AusBond Credit FRN 0+ Yr Index.
|
FLOT yield statistics
|
|
|
Yield to maturity
|
3.03%
|
|
Running yield
|
1.09%
|
|
Dividend yield
|
0.85%
|
All figures as at 30 April 2022. Yield figured quoted do not account for fees or taxes. Yield figures quoted are not a forecast, and are not a guarantee of, the future return of the fund that will vary from time to time. Past performance is not a reliable indicator of future performance.
VanEck Australian Subordinated Debt ETF (ASX: SUBD)
SUBD tracks the iBoxx AUD Investment Grade Subordinated Debt Mid Price Index, which only includes investment grade AUD denominated, floating rate subordinated bonds issued by financial institutions that qualify as Tier 2 Capital under APRA rules.
|
SUBD yield statistics
|
|
|
Yield to call
|
4.99%
|
|
Running yield
|
2.73%
|
|
Dividend yield
|
1.87%
|
All figures as at 30 April 2022. Yield figured quoted do not account for fees or taxes. Yield figures quoted are not a forecast, and are not a guarantee of, the future return of the fund that will vary from time to time. Past performance is not a reliable indicator of future performance.
VanEck Bentham Global Capital Securities Active ETF (Managed Fund) (ASX: GCAP)
GCAP provides investors access to an actively managed, globally diversified portfolio of capital securities. Capital securities consist broadly of Tier 2 and Additional Tier 1 capital securities and include but are not limited to contingent convertible bonds (CoCos), preferred and convertible preference shares, hybrid securities, and subordinated notes.
|
GCAP yield statistics
|
|
|
Yield to call
|
5.65%
|
|
Running yield
|
6.00%
|
|
Dividend yield
|
–
|
All figures as at 30 April 2022. Yield figured quoted do not account for fees or taxes. Yield figures quoted are not a forecast, and are not a guarantee of, the future return of the fund that will vary from time to time. Past performance is not a reliable indicator of future performance.
GCAP does not yet have a dividend yield because it has not yet received twelve months of income.
VanEck Emerging Income Opportunities Active ETF (Managed Fund) (ASX: EBND)
EBND is an actively managed ETF that aims to provide investors with a globally diversified portfolio of bonds and currencies in emerging markets. Emerging markets bonds generally pay higher interest than developed markets bonds offering investors an opportunity to broaden their income horizon with elevated risk.
|
EBND yield statistics
|
|
|
Yield to maturity
|
8.34%
|
|
Running yield
|
7.46%
|
|
Dividend yield
|
4.70%
|
All figures as at 30 April 2022. Yield figured quoted do not account for fees or taxes. Yield figures quoted are not a forecast, and are not a guarantee of, the future return of the fund that will vary from time to time. Past performance is not a reliable indicator of future performance.

