
Buying ‘quality’ companies seems an intuitively straightforward path to investment success. However, definitions of quality vary. As such, so do the outcomes of various quality strategies. What is agreed however is that quality investing aims to identify those companies with durable business models and sustainable competitive advantages. Why? Those companies best weather downturns and outperform in low growth environments. An analysis of the quality factor in Australia illustrates, like when Dorothy’s dog Toto pulled away the curtain to reveal the Wizard, you may not get the quality you expect.
Over the long term, the equity investment strategies that have done well have focused as much on capital preservation as achieving growth. Benjamin Graham, author of The Intelligent Investor, highlights the importance of capital preservation, “Once you lose 95% of your money, you have to gain 1,900% just to get back to where you started.” This is an underlying tenant of quality investing.
In The Intelligent Investor, a book Warren Buffett calls “the best book about investing ever written”, Graham said investors should demand from a company “a sufficiently strong financial position and the potential that its earnings will at least be maintained over the years.”
MSCI, the index provider best known for its World Indices, created its own Quality Indices which “identify quality growth stocks by calculating a quality score for each security in the eligible equity universe based on three main fundamental variables: high return on equity (ROE), stable year-over-year earnings growth and low financial leverage.”
There is a parallel between MSCI’s quality characteristics and those Graham insisted investors should demand from companies. Graham defined a strong financial position as one where long-term debt does not exceed current net assets and there is a high ROE. Graham argued that the best way to determine whether earnings will be maintained is to examine the earnings of the company over its past ten years. This is almost exactly what MSCI seeks to do with its quality factor.
Investors familiar with VanEck MSCI International Quality ETF (QUAL), which tracks a MSCI Quality Index, will be aware of its performance characteristics and we have written about this many times in the past, most recently here.
To recap, history has persistently shown that in times of volatility quality companies have outperformed when markets fall, they lose less and recover faster.
In the chart below, when the purple line is rising, quality is outperforming. In the most recent periods of increased volatility, as measured by the VIX index, quality has outperformed the market benchmark. You can see as volatility during the COVID crisis peaked, quality outperformed. During the period of low economic growth in the decade after the GFC, you can see that quality steadily outperformed, particularly in periods of heightened share market volatility such as the Eurozone crisis and the stock market sell-off that started in August 2015.
Chart 1: Relative performance of MSCI International Quality versus VIX
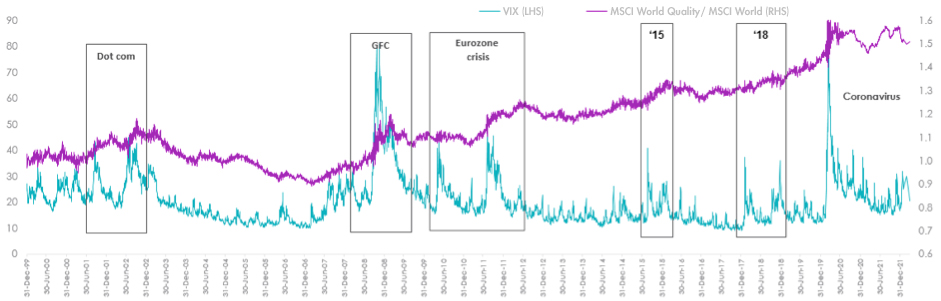
Source: MSCI Data/Calculations, Bloomberg, December 1998 to 31 March 2022. Chart shows performance of MSCI World ex Australia Quality relative to MSCI World ex Australia compared to VIX Index calculated daily. Results include the reinvestment of all dividends, but exclude fees and other costs associated with an investment in QUAL. You cannot invest in an index. Past performance is not a reliable indicator of future performance of the index or QUAL.
QUAL is a portfolio of international equities. The index it tracks is ex-Australia. The question then is, does MSCI’s quality factor also work in Australia?
Below is a chart 1 updated to include MSCI Australia IMI Quality Index compared to the S&P/ASX 200. In this chart, when the blue line is rising quality is outperforming.
Chart 2: Relative performance of MSCI Australia Quality verses VIX
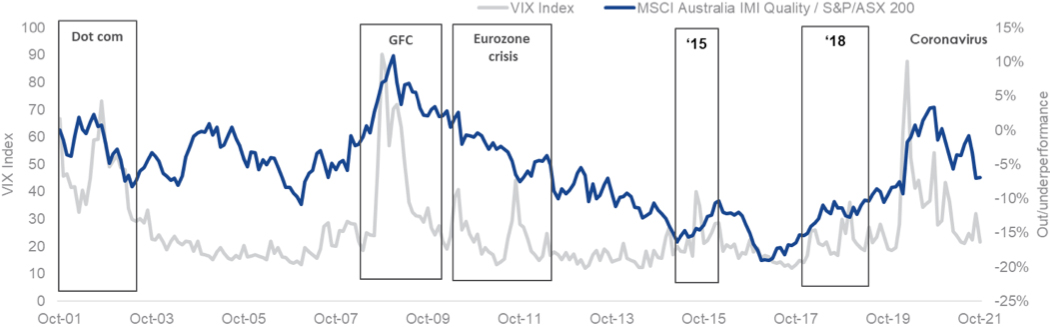
Source: MSCI Data/Calculations, Bloomberg, October 2001 to 31 March 2022. Chart shows performance of MSCI Australia IMI Quality relative to S&P/ASX 200 compared to VIX Index calculated monthly. Results include the reinvestment of all dividends, but exclude fees and other costs associated with an investment. You cannot invest in an index. Past performance is not a reliable indicator of future performance of the index.
Quality in Australia, using MSCI’s Quality Australia Index does not perform the way investors would expect quality to behave as it did in Chart 1. In Chart 1, there is a noticeable incline during the decade of low growth after the GFC. That incline does not occur in MSCI’s Australia quality. MSCI’s Australia quality index underperformed in 2011 as markets were on tenterhooks about high deficits in part of Europe. The opposite to what happened in international equities.
What could cause MSCI Australia Quality Index to behave differently from its international quality index?
Let’s start at the starting point, it’s a very good place to start.
The right starting point
The starting point of MSCI World ex Australia Quality Index, the index QUAL tracks, is the MSCI World ex Australia Index. This is the market benchmark for Australian investors investing internationally.
As MSCI themselves note, investors that start with the wrong benchmark may create a divergence and thus not achieve true exposure to the factor they are targeting. This discrepancy between the manager’s benchmark and the different starting point is known as benchmark misfit. This was identified in a research paper from MSCI, Benchmark Misfit Risk: Identifying the Risk Contribution Arising from Differences in Manager and Policy Benchmarks.
The benchmark for Australian equities is the S&P/ASX 200 Index. It is possible that the MSCI Australia Quality Index is a victim of Benchmark Misfit Risk as it uses the incorrect starting point.
The market benchmark for Australian equities is the S&P/ASX 200. S&P however have a slightly different take on quality. The characteristics they use are based on return on equity, accruals ratio and financial leverage ratio. If the purpose of S&P Quality is identify those companies with durable business models and sustainable competitive advantages, you would still expect its performance characteristics, particularly in periods of heightened volatility to be similar to QUAL.
Chart 3: Relative performance of S&P/ASX 200 Quality Index versus VIX
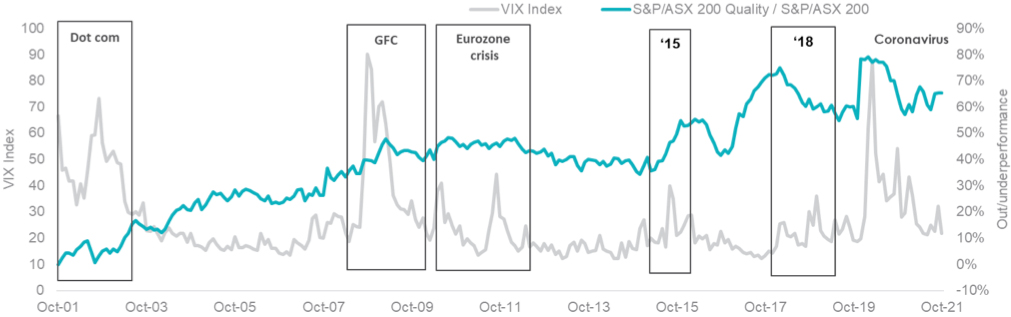
Source: S&P Data/Calculations, Bloomberg, October 2001 to 31 March 2022. Chart shows performance of MSCI Australia IMI Quality relative to S&P/ASX 200 compared to VIX Index calculated monthly. Results include the reinvestment of all dividends, but exclude fees and other costs associated with an investment. You cannot invest in an index. Past performance is not a reliable indicator of future performance of the index.
As you can see in the chart above, again, the quality factor in Australia has not performed as expected, in line with the international quality experience. This index was flat during the period of slow growth in the decade after the GFC. Unlike other quality indices, the index outperformed during the lead-up to the GFC. This is a different outcome to the MSCI Australia Quality Index. In addition to the starting point, the difference in methodology may explain the difference. Irrespective, the S&P Australia quality index does not reflect the investment outcome you would expect from an index that focuses as much on capital preservation as achieving growth.
Looking at the differences between international equities and Australian equities
Two of the world’s most recognised index providers calculate Australian quality indices that do not appear to exhibit the characteristics of the quality factor that are displayed in international equities.
There are fundamental characteristics of the benchmark Australian index that make it different to other share market indices. Some of these are outlined in the table below:
Table 1: Differences between international and Australian equities
| International equities | Australian equities | |
| Size | An huge universe of companies | A small universe of companies |
| Stock diversification | Many stocks from many industries | Concentrated market
Top 5 stocks make up 40% of the benchmark index |
| Sector diversification | Technology is the biggest sector, composition of sectors in the index has evolved | Financials and materials dominate, as they have for a very long time. |
Source: VanEck
What is noticeable, when you look at the constituents in both MSCI’s and S&P’s Australia quality index, is the absence of the big banks. The reason is understandable, banks are highly leveraged, so any index that identifies financial leverage as a quality characteristic will exclude Australia’s banks.
Table 2: Top 10 of Australia Quality indices
| MSCI IMI Australia Quality Top 10 | S&P/ASX 200 Quality Top 10 | |||
| BHP Group | 6.90% | Rio Tinto | 6.50% | |
| Rio Tinto Ltd | 7.03% | BHP Group | 6.10% | |
| CSL | 4.43% | Cochlear | 5.41% | |
| Wesfarmers | 4.34% | Fortescue Metals Group | 5.37% | |
| Fortescue Metals Group | 6.30% | ASX | 4.91% | |
| Goodman Group | 4.84% | Transurban Group | 4.83% | |
| James Hardie Industries | 4.42% | ResMed | 4.73% | |
| Newcrest Mining | 4.93% | CSL | 4.54% | |
| ASX | 3.99% | Sonic Healthcare | 4.25% | |
| Sonic Healthcare | 3.60% | James Hardie Industries | 4.14% | |
Source: MSCI, S&P, as at 28 February 2022
It is possible the Australian market does not have the breadth and depth of companies for a quality factor index that is able focus as much on capital preservation as achieving growth as is possible in other markets like international equities. The investment outcomes of Australia quality indices may not match investor’s expectations of quality.
While active managers that target quality companies may have been successful, it is likely they also either:
- combine other factors with quality; or
- have a sustainable investment edge that they use to target the best companies.
Factor indifference
There are many ways, beyond quality investing, to invest in a diversified portfolio of Australian equities. Investing in Active Australian equity funds is popular, but as S&P’s SPIVA report illustrates, picking the active fund manager that will outperform is difficult. You could perhaps use other factors, such as value or low-size, you may just be happy with the market index or you could be factor indifferent and equal weight.
Lookout for a forthcoming VanEck whitepaper analysing different factors, such as quality, in Australian equities and the implications for investors.

