
Gold has fascinated man for at least 6 millennia, with evidence of mining before 4,200BC in Georgia.
It was written in clay-tablets that one-ounce of gold should buy a man a fine suit and clothing accessories. Quality and taste vary – but you can acquire locally a good quality entry-level bespoke business suit plus accessories for around A$2,500 or US$1,800 i.e., close to current gold price per troy ounce.
To assist investors to see if gold price trends are favorable now, we turn to some more contemporary drivers of gold supply and demand.
Gold demand
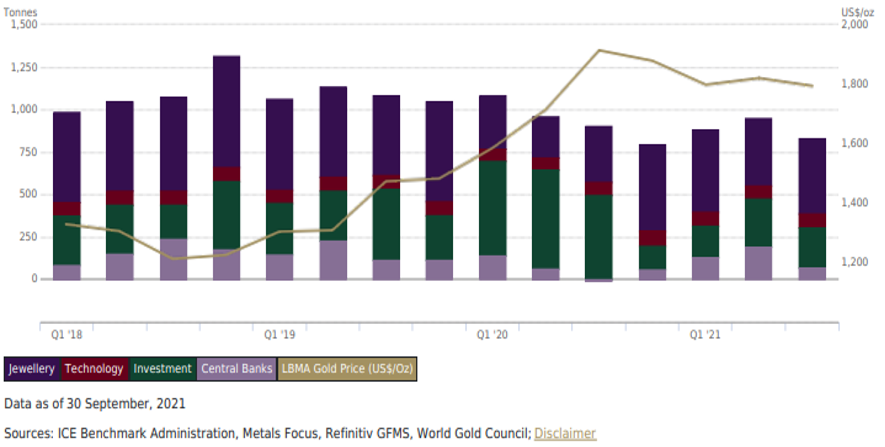
While jewelry sales appear large, overall demand is dominated by investors. This also includes central bank hoarding, and a sizable portion of jewelry is a savings proxy, particularly in the Middle East, India and Asia.
The composition of final gold demand changes with expected gold price moves and affordability of gold jewelry.
Industrial demand is relatively stable at any price. It has a ~8% market share and is used in precision electrical equipment and aerospace. See the Technology portion in Chart – 1 below.
Chart – 1 Gold demand, quarterly; Source: Gold Hub
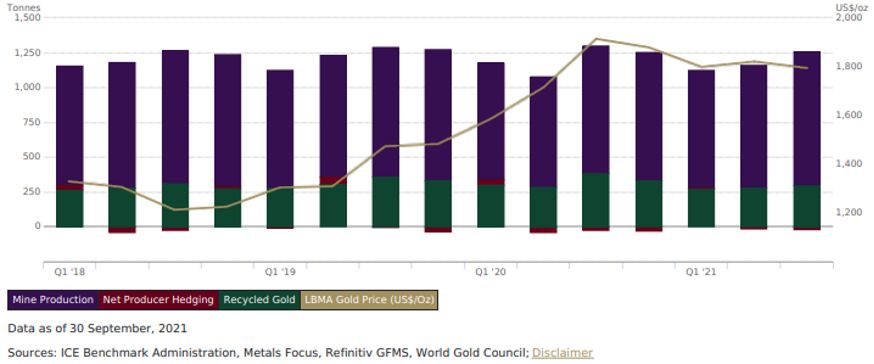
Looking at supply – Newly mined gold production is nearly 80% of global supply. The remainder comes from recycled jewelry and obsolete appliances like computers. The difference between demand and supply is met by hoarding/dishoarding of gold by investors, central banks and to a lesser extent by producer hedging activities.
Gold price dynamics
Gold price rises tend to reduce jewelry demand and raise recycled gold supply. Subject to the costs of new output, this can also boost additional mine production, though with a lag. This can help set the overall levels of gold prices. Crucially, these impacts on demand and supply are generally reactive to the gold price, rather than causative of immediate gold price dynamics.
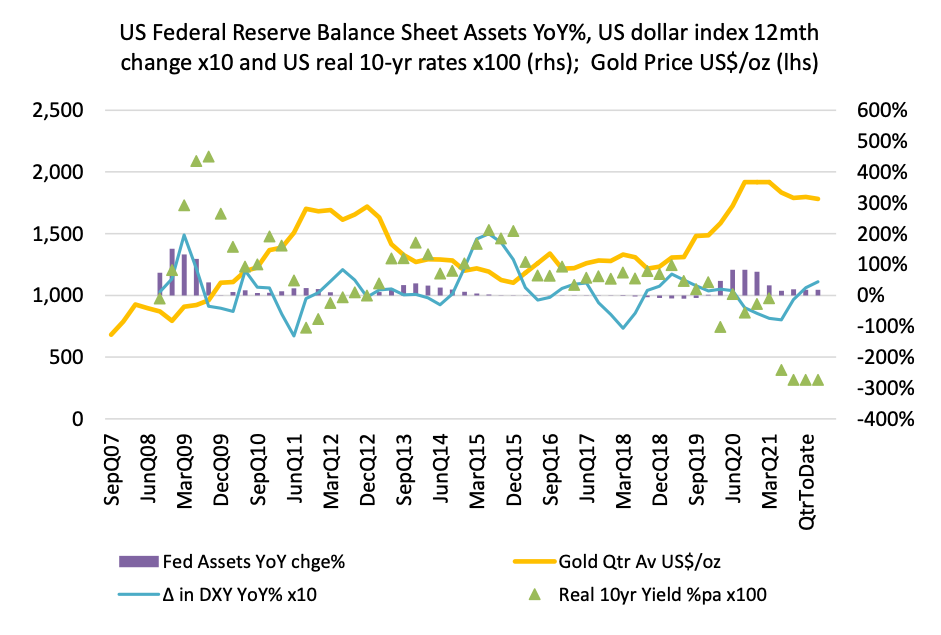
Gold investment demand is highly dynamic. Investment demand depends upon expectations of future price moves and precautionary demand during unstable times. These expectations are influenced by many factors including hard to predict financial sector crisis, geo-political issues and recently, the Covid-19 pandemic. However, we focus upon three highly visible and widely traded financial drivers to discern potential causative factors that tend to move the near-term gold price, see Chart – 3.
- US dollar currency changes relative to other currencies. We use the DXY Index – an approximate trade-weighted US currency rate. The DXY is up 7% year-to-date and its rise makes gold look more expensive in non-US dollars increasing risk of a weakening the gold price in US dollars.
- US real interest rates – Unlike bonds, gold yields no interest return. However, gold is seen as a rough proxy to maintain its real value. If after-inflation 10-year US T-bond yields fall, the lower real yield reduces the opportunity cost of holding gold. The recent blow-out in negative real interest rates to around -2.4% makes gold very attractive relative to fixed-yield bonds.
- Changes in US Federal Reserve’s balance sheet assets – “Quantitative Easing” (QE) policies resulted in a big pulse of “The Fed’s” assets during 2020. This enabled a surge of liquidity into the banking system that was quickly recycled to financial assets and gold. Only later does this tend to boost bank loans to business and households. Initially QE policy inflates asset prices including gold. With a lag, it then raises goods & services demand. Depending upon supply bottlenecks, consumer prices may rise as well. With the US Fed starting the tapering of QE and a rising CPI, financial asset prices, and perhaps gold may struggle.
Chart – 3: Three financial drivers of the gold price – Data Source: Factset
Gold’s bull market in 2019-2020
The 2012 to 2018 period saw gold prices fall after the strong GFC run. The rise in real yields (see green triangles in Chart – 3) and by 2015 a big rise in the US dollar rate (DXY blue line) heavily blunted investment demand for gold. Federal Reserve assets’ year-on-year asset growth (purple bars) was very low and was not supportive of the gold price.
The gold market started a rebound during 2019 as real yields fell and the Trump pro-cyclical company-tax stimulusweakened the US’s fiscal balance and the US dollar. Then the Covid-19 crisis saw a major resumption of QE stimulus and a bigger US dollar decline. In 2020 the three financial factors were bullish for gold and its price rose over 60% to peak at US$2000/oz in mid-2020.
Gold’s mid-2020 to 2021 plateau – now at risk
Since mid-2020 our three financial drivers have changed and no longer pull in the same direction.
Firstly, bullish – has been the plunge of real interest rates to around negative 2.5% as the rise in inflation was not matched by the rise in US 10-year T-Bond yields. Should deep negative real yields persist, it would be highly constructive for gold prices. However, in the absence of ongoing QE, bond investors must eventually seek a return. This points towards an eventual reduction in negative interest rates and this view may tend to restrain the upside of the near-term gold price.
US-dollar’s rise is negative for gold – The recent surge in the DXY-index makes it more difficult for gold to rise. The DXY trend appears set for a while longer as the US economy strengthens post Covid-19, though traders need to be alert for any abrupt change in the US currency’s trend.
A bearish signal is emanating from the US Federal Reserve with its decelerating balance sheet asset growth. Reducing, and eventually a partial reversal of QE, combined with a growing government bond issuance may result in the dreaded four f’s – falling fund flows to financial assets. If it coincides with rising loans to the non-financial real sectors of the economy on the post-Covid-19 activity bounce, there could be a significant tightening liquidity. In the absence of financial crisis, this is may be also negative for gold prices.
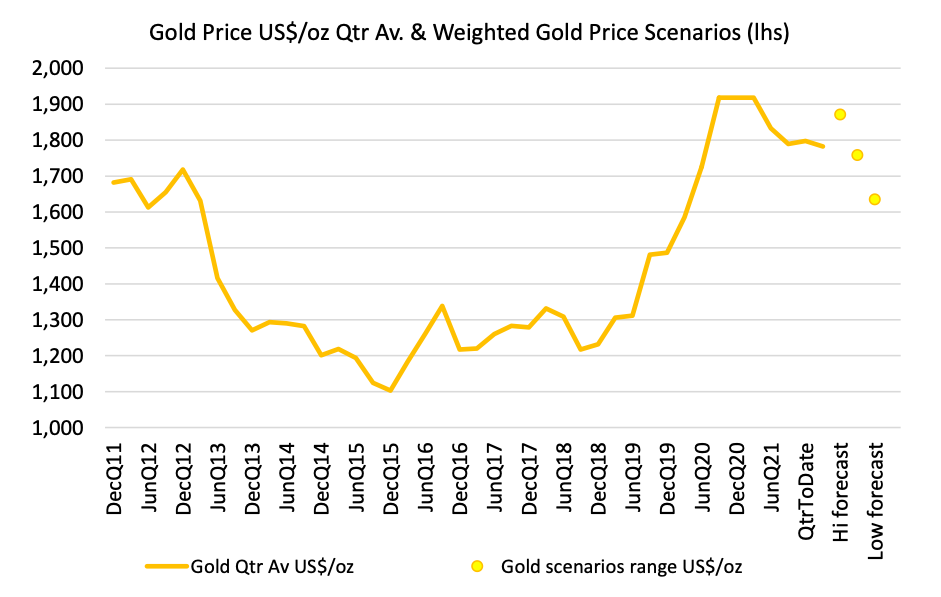
Chart – 4: Gold price and indicative algorithmic scenarios – Data Source: FactSet, author estimates
Indicative scenarios for the gold price during 2022
Chart – 4 shows the last 10-years of gold price movements. It also provides a bullish to bearish range of algorithmically indicative scenarios for the gold price over the next 3 to 6 months. To achieve this, we examine the trend ratio of gold price to the US dollar DXY Index. We then apply a persistence of this ratio as well as a reversion to trend of the same ratio. This process generates high, mid- and low gold price “scenarios” rather than forecasts. In this model, we weight these scenarios at 40%.
Similarly, we take the Federal Reserve’s assets to gold price ratio, and again provide varying levels of mean reversion to generate gold price scenarios. These results are weighted 20%.
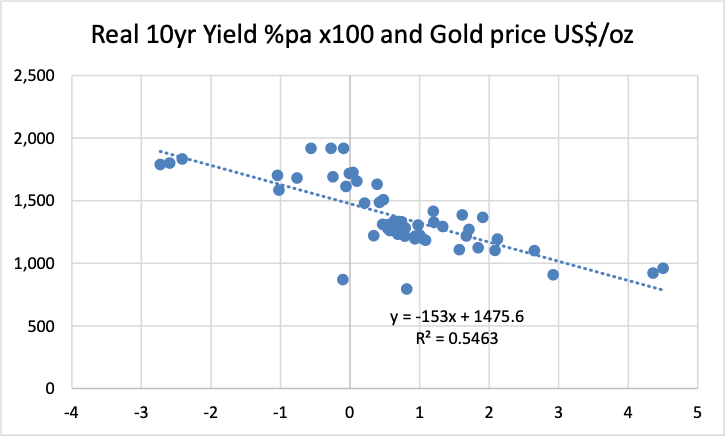
Finally, we apply the function in Chart – 5 derived from the inverse relationship gold price to real interest rate plot chart. Incremental reductions in negative real rates generate gold price scenarios. These outcomes are weighted 40%.
Chart – 5 US Real Yields versus Gold price US$/oz – Source FactSet
Conclusion – a bumpy ride, but has a place in a diversified portfolio
Gold appears set to break out of its 2021-year plateau of around US$1,800/oz. Our three-financial factors no longer all point positive for gold. Indeed, two factors suggest a chance of a fall to perhaps US$1,750/oz to $1,650 range. This may be driven by a tightening in liquidity and on-going relative strength of the US-dollar. These signals may get stronger as “QE” is wound back, the bond selling task becomes onerous and the US real sector activity absorbs previously spare liquidity. However, a should there be a persistence of negative interest rates, this is highly supportive of gold price, with suggestions of movement towards US$1,900/oz or more.
We don’t claim to forecast the gold price, as beside pure financial drivers, many factors impact gold including the resurgence of new variant Covid-19 or geo-political issues or just plain sentiment swings. The message is that the gold price is likely to be impacted by movement in real interest rates and how hawkish or otherwise The US Fed and other major Central Banks become during 2022.
Longer term, I’m comfortable with gold as part of a well-diversified portfolio. A safely guarded ounce of gold will outlive any financial system, political regime, or cryptocurrency… and an ounce will still buy that suit.
NOTICE: This communication explicitly does not constitute a recommendation to trade any security. Investors should seek appropriate professional advice prior to trading any listed or unlisted security, commodity or asset.

