
Economic conditions over the past 5 years have been relatively benign, meaning the relationship between these 3 factors has not been a major market focus. However, with the spread of the COVID-19 virus and associated government response, that environment has begun to show signs of change. In particular, inflation pressures have begun to emerge, along with market discussions surrounding the direction of interest rates.
We have previously examined the infrastructure/interest rates/inflation dynamic in Global Matters articles published in April 2016 (Listed infrastructure investment and rising interest rates) and April 2018 (Is infrastructure a bond proxy?). In this article, Sarah Shaw (4D’s Global PM & CIO) Greg Goodsell (4D’s Global Equity Strategist) and the 4D investment team revisit and expand that earlier work.
In order to properly examine the infrastructure/interest rates/inflation dynamic, we wanted to firstly provide a brief backdrop of the prevailing macro-economic environment and how we perceive key factors playing out.
Global Economic Outlook
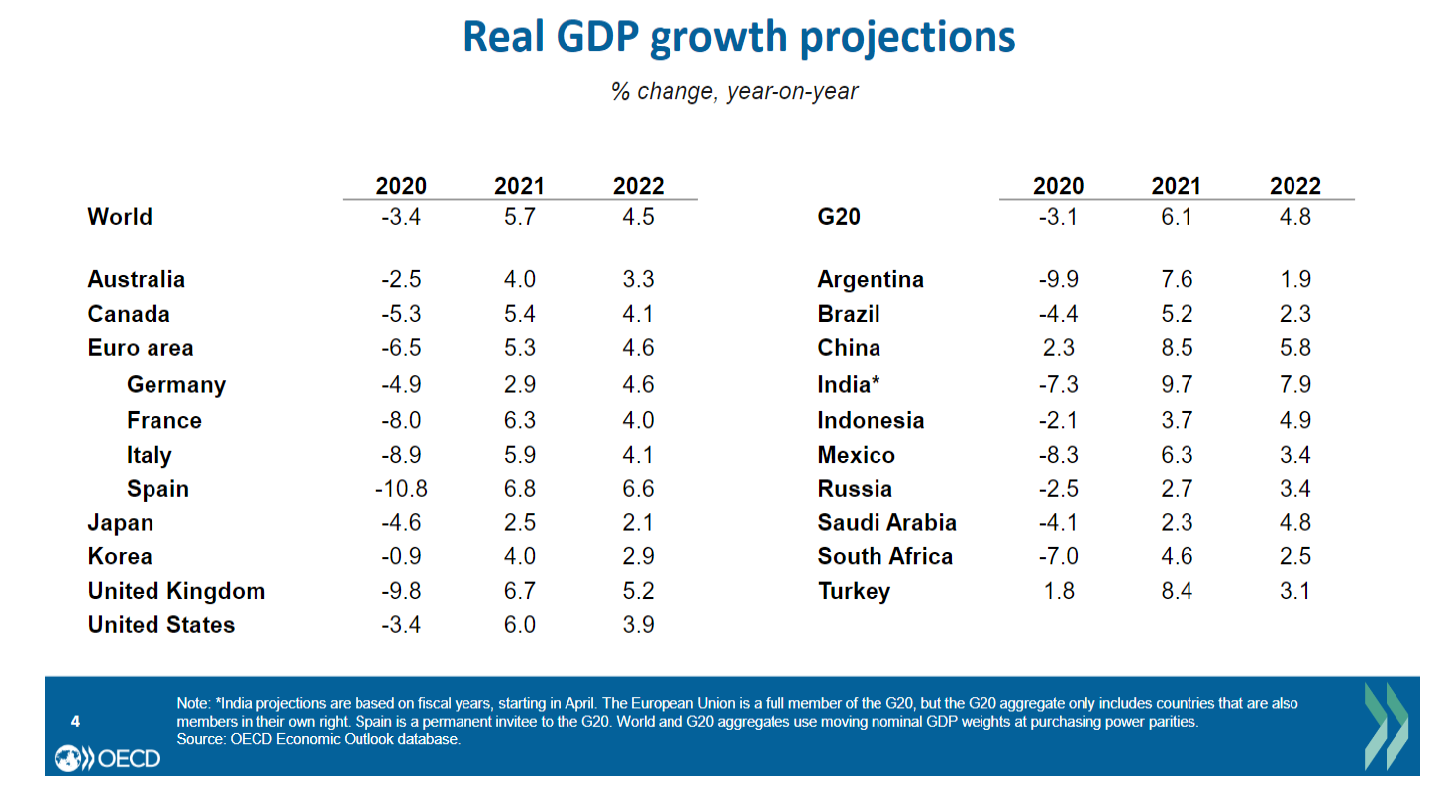
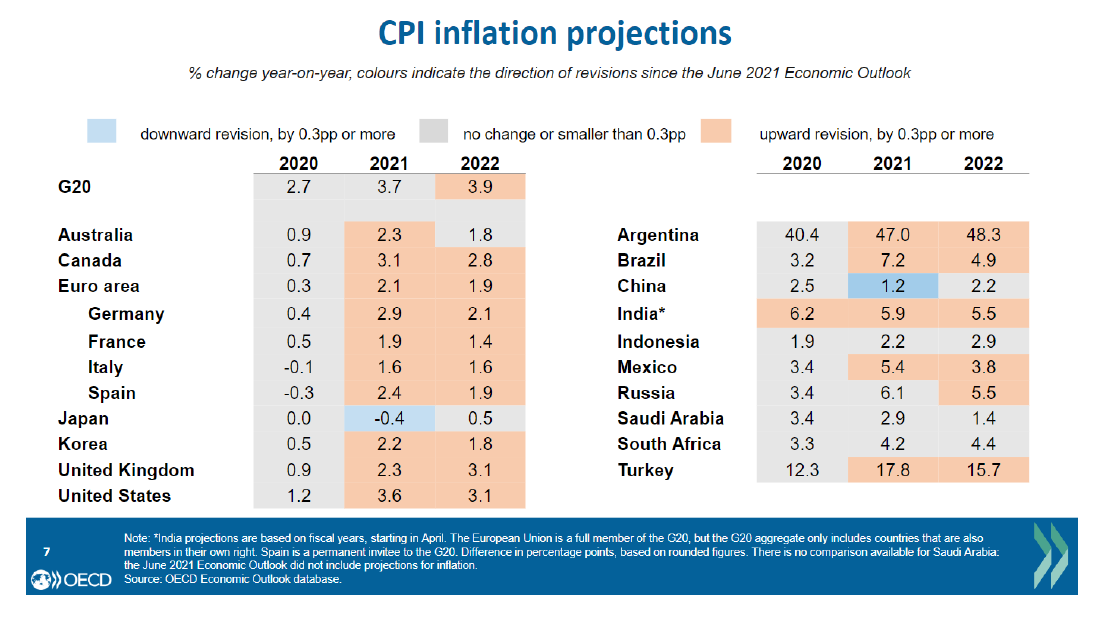
GDP growth in 2021 looks like being curtailed somewhat compared with expectations 6 months ago, as the Delta variant continues to spread and supply chain disruptions put pressure on prices. However, despite the ongoing presence of the pandemic, the outlook for 2021 remains robust and we remain optimistic about the outlook for the global economy and infrastructure asset class for 2022 and beyond. The latest (September 2021) OECD GDP growth forecasts, shown below, are supportive of our view.
Our optimism for an ongoing recovery stems from the following.
COVID-19 vaccines are being deployed globally with high and increasing vaccine rates emerging
COVID-19 vaccines have been developed in record time, are now being deployed and are proving to be very effective in preventing severe onset of the disease. You can be certain that vaccine versions 2.0+ are currently being developed, along with other modes of COVID treatment. This is truly remarkable and should hopefully see the currently rampant virus gradually tamed.
Bloomberg reports (September 2021) that India will restart exports of COVID-19 vaccines for the World Health Organization’s Covax initiative, even as it races to inoculate its own adult population. Italy has started giving third doses of vaccines to its most vulnerable citizens. The US will soon allow most foreign air travellers to enter as long as they’re fully vaccinated; and it has added a testing requirement for unvaccinated Americans. The UK has also significantly simplified its travel rules and restrictions along with many parts of South America, and even Australia is hinting at a 2021 international re-opening. The Pfizer-BioNTech vaccine was deemed safe and produced strong antibody responses in children ages 5 to 11 in a large-scale trial, according to the companies: findings that could pave the way to begin vaccinating grade-school kids. US regulators are expected to decide soon on whether and how booster shots should be administered in the US, where the death toll has surpassed that of the 1918 influenza outbreak.
As vaccine percentages rise, lockdowns lift – which sees a huge demand boost
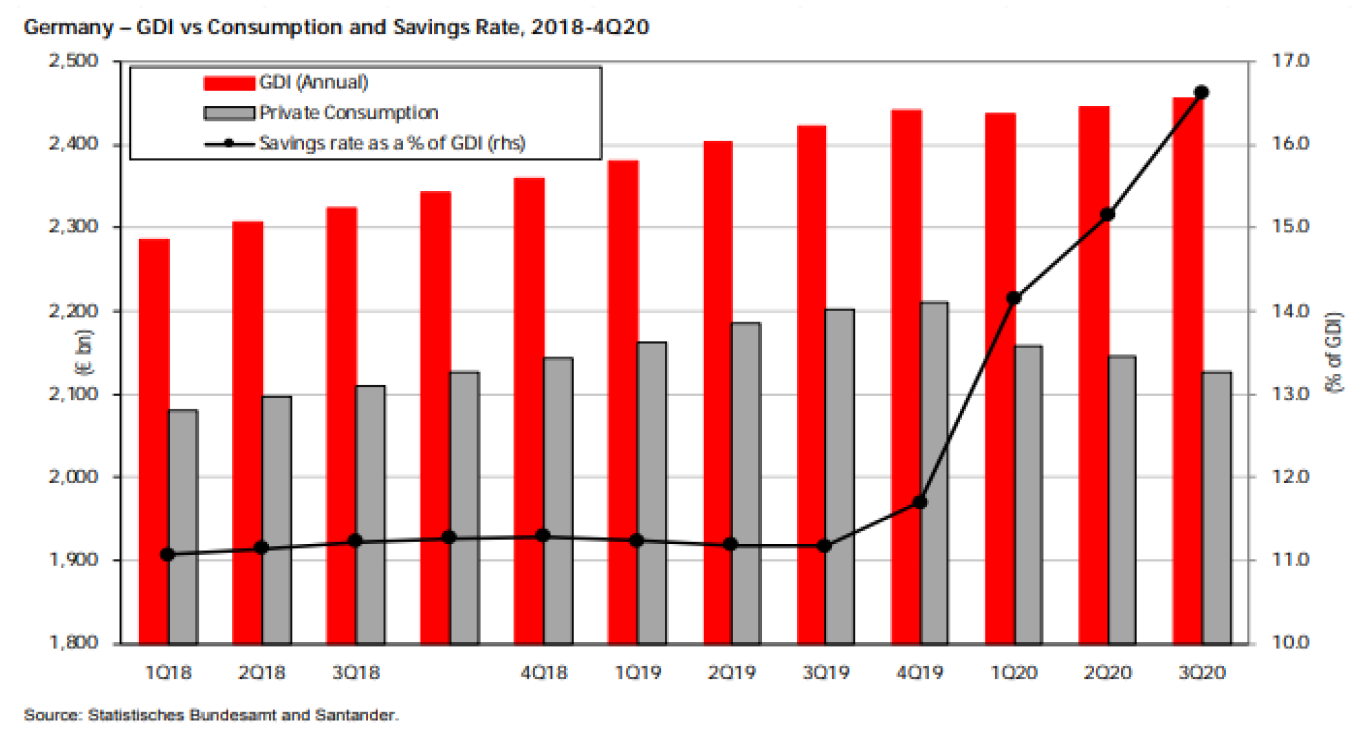
As the level of vaccinations around the world rises and greater acceptance of living with the virus emerges, lockdowns gradually get lifted – releasing an immediate boost of pent-up demand and adding to the recovery. This quantum of pent-up demand is illustrated in the following chart, which shows a rapidly accelerating savings rate (as a % of GDP) in Germany in 2020 as lockdowns held consumer spending in check.
Huge fiscal and monetary stimulus will continue to propel global economic growth
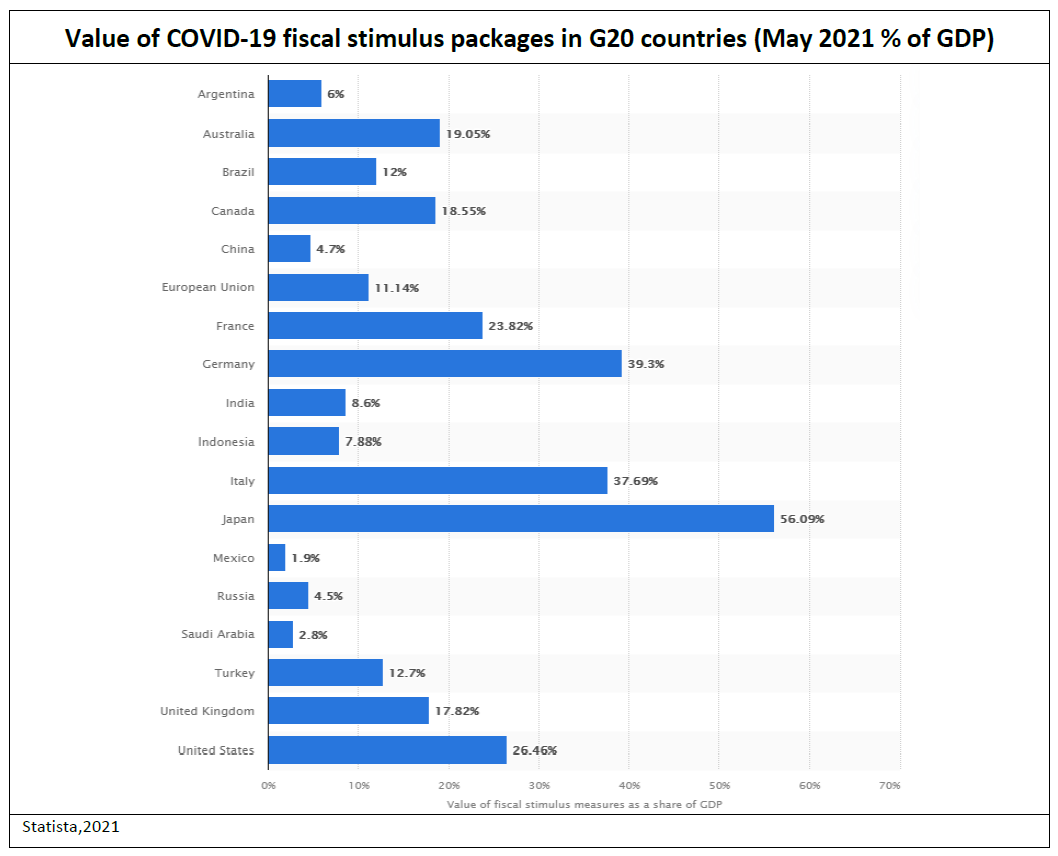
Prior to the advent of the Delta strain, it was beginning to look as if significant global fiscal and monetary stimulus would begin to be wound back. However, that does not look to be the case now. For example, UBS[1] estimates that, in aggregate, only 8% of last year’s stimulus will have been reversed by the end of 2021. Of course, that is largely because the virus keeps flaring up and because severe mobility restrictions have been reimposed by numerous countries at some point this year while they rush to vaccinate the populous. This has necessitated extending last year’s support schemes and the approval of some new ones, pushing the adjustment out to 2022.
According to the IMF[2], since March 2020 governments have spent ~US$16 trillion providing fiscal support amid the pandemic, and global central banks have increased their balance sheets by a combined US$7.5 trillion. Budget deficits are the highest they have been since World War II and central banks have provided more liquidity in the past year than in the past 10 years combined. However, this was necessary – IMF research indicates that if policymakers had not acted, last year’s recession, which was the worst peacetime recession since the Great Depression, would have been three times worse. The world lost US$22 trillion in output as a result of COVID-19, relative to what the IMF expected in January 2020.
Governments around the world are no doubt looking forward to the economic rebound and the return of consumption and inflation as they seek to reduce their debt burden and wind back support.
Infrastructure investment is key to the longer-term global solution
While we think the pandemic will last longer than was initially hoped, we believe the global economy will ultimately emerge stronger for the experience. The huge amount of fiscal and monetary stimulus is still to be fully felt in economic terms with much of that spending focused on essential infrastructure investment around the globe, including the green energy transition.
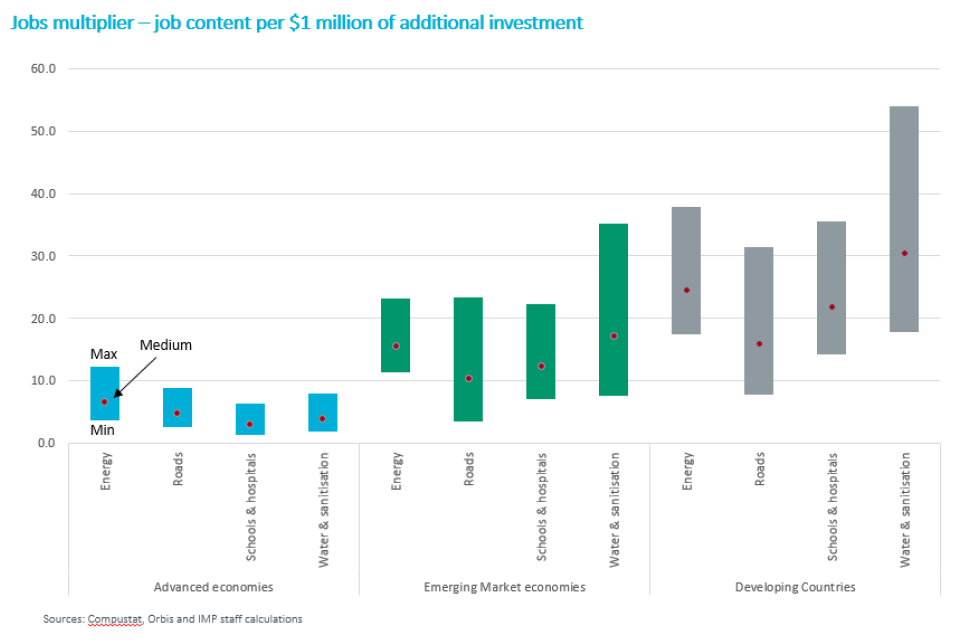
Recent IMF research[3] shows how effective such expenditure is in boosting jobs and growth. When governments invest in infrastructure, they create many new jobs (see graphic below). The IMF evaluated the direct employment effect of public investment in the key infrastructure categories of electricity, roads, schools, hospitals, water and sanitation. Using data from 41 countries over 19 years, the IMF estimates that US$1 million of public spending in infrastructure creates 3-7 jobs in advanced economies, 10-17 jobs in emerging market economies, and 16-30 jobs in low-income developing countries. Overall, the IMF estimates that 1% of global GDP in public investment can create more than 7 million jobs worldwide through its direct employment effects alone. The infrastructure spend economic ‘multiplier’ is significant.
Infrastructure stimulus packages in practice
After months of negotiations, Bloomberg reports (August 2021) the US Senate passed a US$1.2 trillion infrastructure plan (US$550 billion in new federal investment) that would represent the biggest burst of spending on US public works in decades. The bipartisan 69-30 vote marked a significant victory for President Joe Biden’s economic agenda. The bill still faces hurdles in the House, but if the package clears both chambers it includes new spending for roads and bridges, power grid upgrades and broadband expansion.
Similarly, India, Reuters reports (August 2021), will launch a 100 trillion rupee (US$1.35 trillion) national infrastructure plan that will help generate jobs and expand use of cleaner fuels to achieve the country’s climate goals, PM Narendra Modi said. The infrastructure program, called ‘Gati Shakti’, will help boost productivity of industries and boost the economy, Mr Modi said during his speech at the Independence Day celebrations in New Delhi: ‘We will launch a masterplan for Gati Shakti, a big program … (it) will create job opportunities for hundreds of thousands’. Boosting infrastructure in Asia’s third largest economy is at the heart of Mr Modi’s plan to pull back the country from a sharp, COVID driven economic decline.
These recent infrastructure specific programs follow the EU, which was a very early proponent of the infrastructure led recovery having launched its €750bn Next Generation EU recovery fund in H2 2020.
Inflation is the key risk
Critical to the positive scenario outlined above is the issue of inflation. The past 6 months has seen some inflationary spikes which are raising concerns. There are two broad schools of thought regarding inflation.
- Inflation is here to stay
This view is that inflation is here, if not to stay, then for a long time – possibly in a 1970s type double digit inflationary scenario. This argument has its origins in the huge amount of fiscal and monetary stimulus that has occurred so far (see above). All these dollars need to go somewhere and one argument is that we will see permanent, wide-spread inflationary pressures.
- Current inflationary spikes are transitory driven by the unique environment we are in
This argument, which can probably be seen as consensus (the US Fed, IMF, RBA, ECB are in this camp), is that there are no broad spread inflationary pressures on wages and that current inflationary blips are driven by things such as the 2020 economic numbers being so distorted by COVID that when we look at the yoy change in 2021, the resultant answer is not representative of the underlying environment.
Another argument for the current inflationary forces being transitory is that the ‘supply chain disruptions’ caused by the pandemic have contributed to recent price hikes. Bloomberg reports (August 2021) that these disruptions remain prevalent in the global economy. Chip shortages that have held back automakers and computer manufacturers are getting worse. Chip lead times, the gap between ordering a semiconductor and taking delivery, increased by more than 8 days to 20.2 weeks in July from the previous month. That gap was already the longest wait time since tracking this data began in 2017. Shortages of microcontrollers, logic chips that control functions in cars, industrial equipment and home electronics jumped in July. Even Toyota is affected. The automaker warned it will suspend output at 14 plants across Japan and slash production by 40% due to supply disruptions, including chip shortages.
Our view is that the recent inflationary spikes are transitory and will gradually ease over time. However, this is not to say we don’t expect a modest level of inflation to gradually return – this is what central banks are targeting, and what we would like from an infrastructure investment perspective. Given the quantum of stimulus yet to flow through into the real economy, coupled with the huge pent-up consumption demand reflected in deposit rates having spiked through the pandemic, we do expect some inflationary pressures will emerge over time. While we will be monitoring this closely, we are currently in the camp of near-term inflationary spikes, with a gradual return of sustained modest inflation over time. As such, we don’t see central banks being forced into any drastic action such as near-term interest rate hikes. We are also of the belief that central banks may let inflation run somewhat ahead of target over the short to medium term, to assist in the reduction of headline nominal government debt to GDP levels.
OECD September 2021 inflation forecasts are shown below.
Infrastructure and interest rates
Whatever your view on the nature of the current inflationary spikes and outlook, from an investment perspective it is important to understand how infrastructure assets react in an inflationary environment.
A common dictum of listed equity investment is that infrastructure stocks under-perform as interest rates and inflation rise. This is often associated with the perception of these stocks as being a ‘bond proxy’. The logic then flows that, just like a government bond, as interest rates rise, share (bond) prices fall as the present value of their ‘fixed’ future cash flows is now worth less and the required yield from the asset has to increase.
However, many infrastructure stocks have built in inflation protection either directly linked to tariffs or indirectly through their regulatory construct. As such, in our inflationary scenario (outlined above) some parts of the infrastructure universe may enjoy the perfect storm over the short/medium term – namely low interest rates to support future growth, economic activity flowing through to volumes, and explicit inflation hedges through their tariff mechanisms to combat any inflationary pop we may experience.
To appreciate this dynamic, we need to segregate the infrastructure stock universe into its two key classes: User Pay and Regulated Utilities.
User Pays
By their very function, User Pay assets are geared to capture GDP growth and wealth creation. Typical User Pay assets are toll roads, airports, railways and ports, whereby the user ‘pays’ to use the asset. These stocks have a direct positive correlation with GDP growth (volumes) and often have built-in inflation protection mechanisms in their business models (tariffs). As interest rates/inflation increase over time, these protection mechanisms begin to kick in and positively impact earnings. This is then reflected in the relevant stock price and performance.
In addition, in recent years, management at these companies have generally been actively locking in medium to longer-dated fixed rate borrowings during this extraordinarily long period of very low global interest rates. As a result, the impact of higher interest rates on financials should be limited to the issue of new debt, mitigating any overall earnings impact.
Regulated Utilities
In contrast Regulated Utilities, such as electricity, water and gas providers, can be more immediately adversely impacted by rising interest rates/inflation because of the regulated nature of their business. These assets are more ‘bond proxy’ in nature, particularly over the shorter term. While they are slower to realise the benefits of economic growth, at the same time they are less exposed to economic contraction and benefit from lowering interest rates.
The flow through of inflation is dictated by whether the Utility’s return profile is real or nominal. If the Utility operates under a real return model, then inflation is passed through into tariffs much like a User Pay asset. This model is more prevalent in parts of Europe and Brazil, for example, and limits the immediate impact of inflationary pressure – and in fact can positively boost near-term earnings. In contrast, if the Utility is operating under a nominal return model, it must bear the inflationary uptick reflected in certain costs until it has a regulatory reset (see below), when the changing inflationary environment is incorporated into new tariff/revenue assumptions. This nominal model is the standard model for the US Utility sector. As such, those Utilities in a real model will weather inflationary spikes a little better than their nominal peers.
However, in terms of interest rates shifts, the issues for both real and nominal models are consistent. For a Regulated Utility to recover the cost of higher interest costs, it must first go through its regulatory review process. This involves making submissions to the regulator, arguing that prevailing economic conditions have changed and it should be entitled to recover those increased costs via increased rate charges to its client base. While a regulator is required to have regard for the changing cost environment the Utility faces, the process of submission, review and approval can take some time or can be dictated by a set regulatory period of anywhere between 1-5 years. In addition, the whole environment surrounding costs, household rates and utility profitability can be highly politically charged. As a result, both the regulatory review process and the final outcome can be quite unpredictable.
How do User Pay & Regulated Utility assets perform during rising interest rates?
Having established the premise that User Pay assets offer more protection from rising interest rates and inflation while Regulated Utilities can be more vulnerable, we can test this thesis by examining how these two distinct asset sub-sectors have performed during previous periods of rising interest rates.
We examined this scenario back in April 2018 in our GM article Is infrastructure a bond proxy? We concluded that bucketing all infrastructure as a ‘bond proxy’ was a far too simplistic conclusion. Rather, the inherently different asset characteristics of User Pays vs Regulated Utilities, and the performance they deliver, mean infrastructure is an asset class that can be tailored to all stages of a market cycle. User Pay assets facilitate a portfolio being positioned for a GDP growth/rising interest rate/inflationary environment. Conversely, in more difficult economic times, possibly incorporating falling interest rates, Regulated Utilities offer an ideal defensive home given their earnings certainty, which are largely immune to the macro cycle.
Our earlier analysis holds true today, and so we revisit below how User Pay and Regulated Utility stocks performed following: a) a rising US Federal Funds (Fed Funds) rate, and b) rising 10-year US Government Treasury Bond (T-Bond) yields.
Rising interest rate cycles in the US since 2000
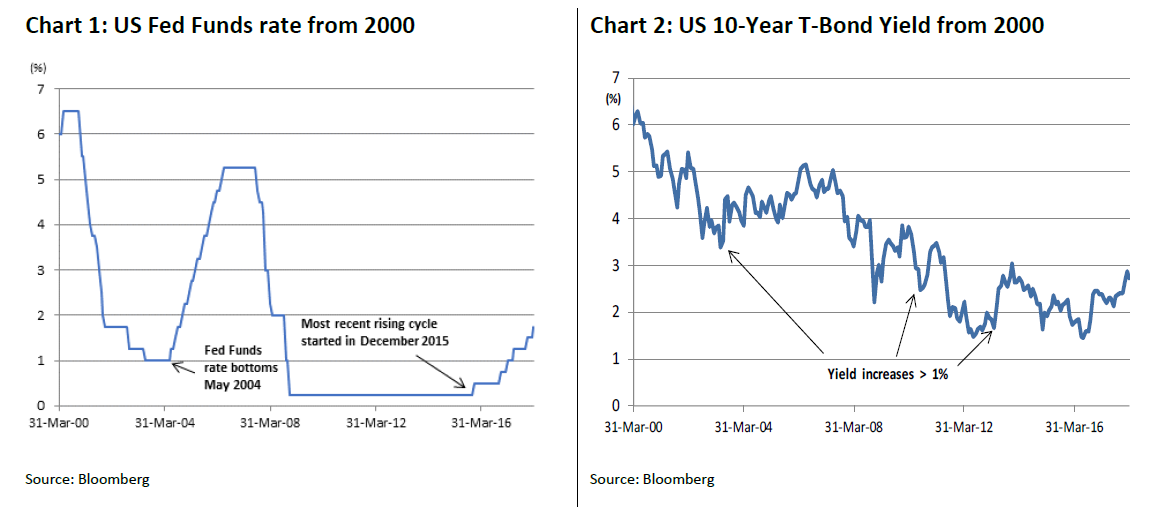
Since 2000, there have been two Fed Funds rate hike cycles (Chart 1) and three periods during which the US T-Bond yield rose by more than 1% over consecutive months (Chart 2).
To test the thesis that User Pay assets can outperform in periods of rising interest rates/inflation, we:
- segregated 4D Infrastructure’s investible universe[4] of ~300 global listed infrastructure stocks into User Pays (the ‘4DUP index’)and Regulated Utilities (the ‘4DUts index’); and
- then examined how these two indices, as well as the S&P Global Infrastructure Index (‘S&PI’), performed versus the MSCI World Index (‘MSCI’ – as a proxy for global equity market performance) during the above time periods – namely, rising Fed Funds rate and rising US 10-year T-Bond yields.
To better understand the performance behaviour of the indices, we separated performance over the first six months and second six months (i.e. months 7–12) after rates started increasing.
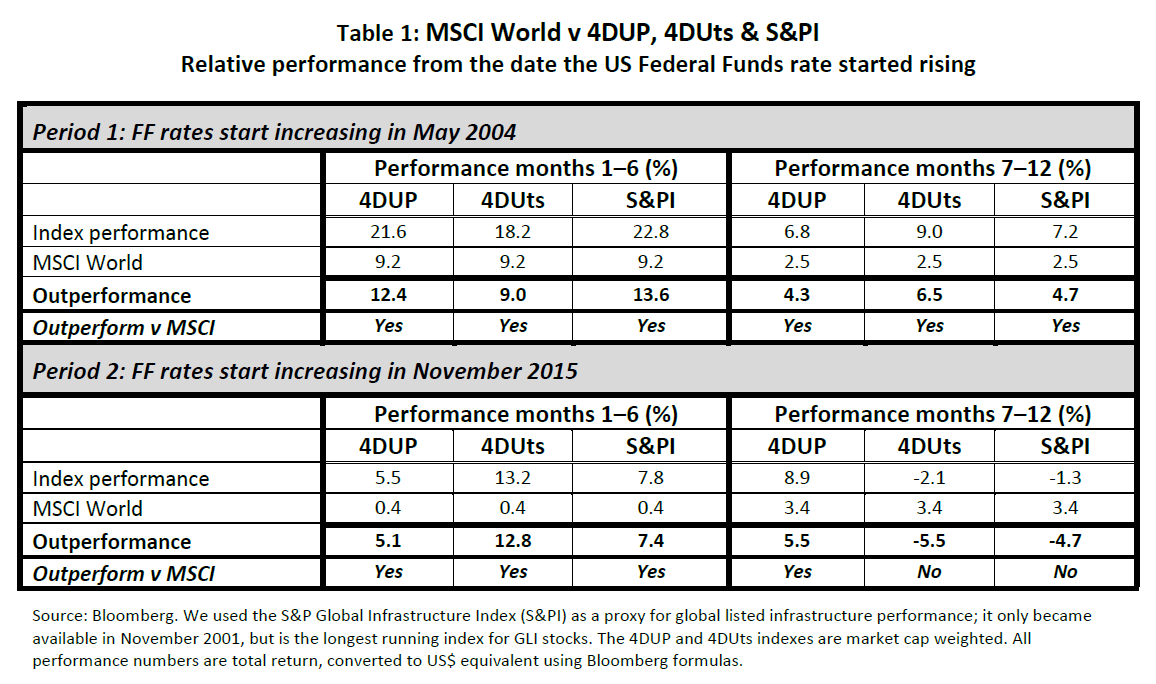
Rising rates 1: Two Fed Fund rate hike cycles since 2000
As shown in Chart 1 above, since 2000 there have been two periods in which the US Fed Funds rate rose by more than 1% over consecutive months. The performances of our infrastructure indices vs the MSCI during these periods are shown in Table 1 below.
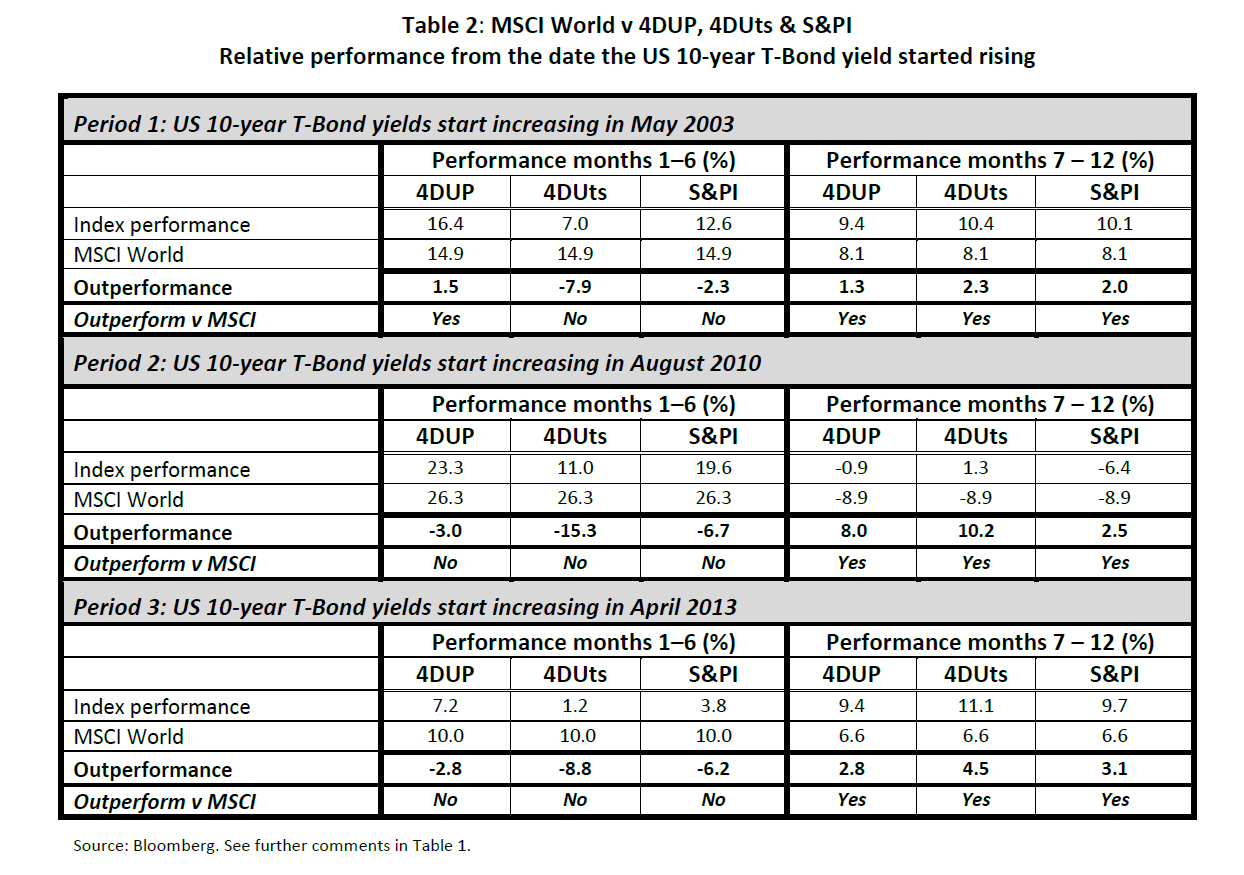
Rising rates 2: Three periods where the US 10-year T-Bond yield rose by 1% since 2000
Chart 2 shows that since 2000 there have been three periods during which the US T-Bond yield rose by 1% over consecutive months. Performance of our infrastructure indices during these periods is in Table 2.
Performance conclusions
As evident in Table 1, a rising US Federal Funds rate:
- did not significantly impact the performance of the 4DUP, which outperformed the MSCI in all four measured periods;
- but the performance of the 4DUts and S&PI were not as strong, significantly underperforming the MSCI during months 7-12 of the November 2015 rate hike cycle.
In contrast, Table 2 suggests that rising US Bond yields are far more influential for listed infrastructure equity market performance. Notably:
- the 4DUP outperformed the MSCI over four of the six measured time periods, underperforming only during the first six months of Periods 2 and 3, and recovering much of that underperformance during months 7-12; and
- both the 4DUts and the S&PI underperformed the MSCI during the first six months of each of the three periods of rising yields before outperforming during months 7-12.
We believe this analysis supports our thesis that User Pay assets are resilient through periods of rising interest rates/inflation and can provide the out-performance sought. In contrast, Regulated Utilities are more inclined to demonstrate the ‘bond proxy’ profile.
Infrastructure & inflation: stock case studies
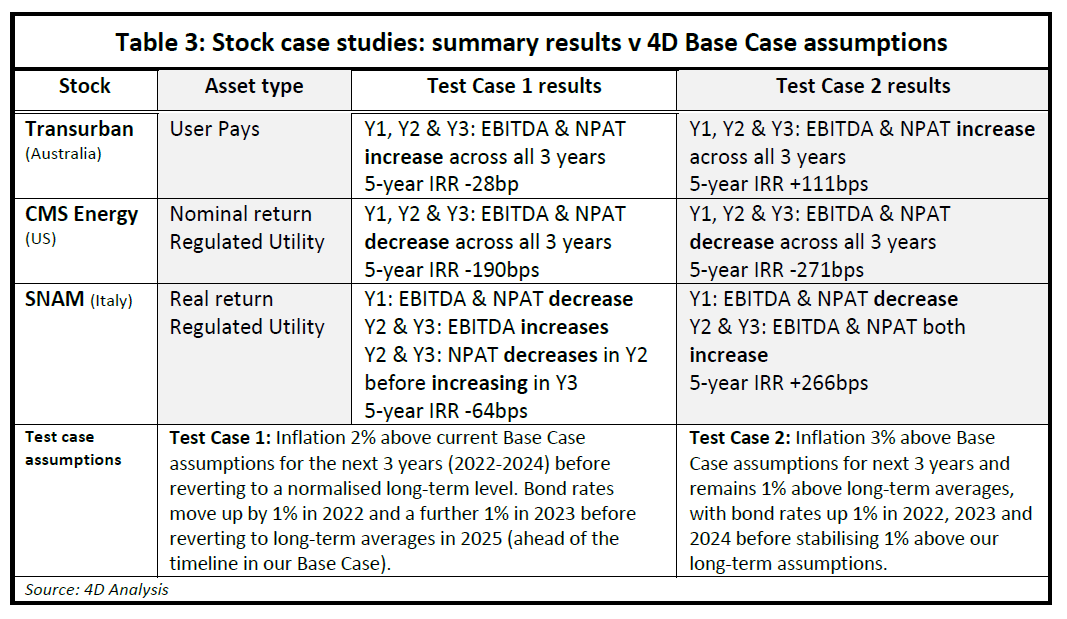
Looking at the issue now at a company level, we used 3 test case scenarios to attempt to illustrate the fundamental impact of higher inflation leading to faster than anticipated increases in interest rates on 3 quite different infrastructure assets – Transurban, CMS Energy and SNAM. A summary of the impact on revenue, EBITDA and earnings (NPAT) over the next 3 years, as well as to the 5-year IRR, is depicted below.
Analytical framework
The analysis below is measured relative to our current 4D Base Case company forecasts. Key assumptions and test cases are summarised below, keeping all other assumptions constant (e.g. GDP growth).
Base Case (current 4D forecasts): Premised on inflation being transitory with a pop in 2021/22 before reverting to a more gradual path to long-term averages. In this scenario, interest rates gradually revert to a normalised level over a number of years.
Test Case 1: Explores the impact of inflation two percentage points above current Base Case assumptions for the next 3 years (2022-2024) before reverting to a normalised long-term level in response to interest rate moves. Bond rates move up by 1% in 2022 (relative to current assumptions) and a further 1% in 2023 before reverting to long-term averages in 2025 (ahead of the timeline in our Base Case). In this case, the higher 2022 bond rate will also impact the discount rate used to value long-term cash flows and will see our cost of equity move up 0.5%[5] pa. This test case assumes inflation moves interest rates but the interest rate response works to bring inflation back to long-term averages.
Test Case 2 (extreme case): Inflation is three percentage points above our Base Case assumptions for the next 3 years and remains 1% above long-term averages, with bond rates moving up 1% in each of 2022, 2023 and 2024 before stabilising 1% above our long-term assumptions.
Summary results
We believe the results of the above test cases applied to our 3 stocks, shown below, support our view that inflation and indeed interest rates do not need to be negative for infrastructure assets in terms of earnings and/or long-term valuations. Instead, the impact is very much dependent on the type of infrastructure asset (as illustrated in the table below). Detailed results can be found in the appendix.
Overall conclusion
We believe the global economic recovery is continuing, although the Delta strand of the COVID virus has likely pushed out the timing of the full recovery. This may cause some unease in equity markets, which had already largely ‘baked in’ a ‘V’ shaped economic recovery.
Inflation remains a key risk, although we believe current inflationary spikes are transitory. However, even if we do enter a period of sustained inflation, we believe infrastructure is the ideal asset class to take shelter in given its explicit or implicit hedges.
In this article we have looked to outline the important differences between User Pay and Regulated Utility assets, and why we believe certain sub-sets should outperform during a rising inflation/interest rate period due to a more immediate and direct hedge. At 4D we remain overweight User Pay assets and within the Regulated Utility sector favour those with real returns. However, should the market overreact to the economic outlook we would use it as a buying opportunity across all sectors.
Download a copy of the article HERE

