
by Blair Modica
Looking at headline returns is a great way to quickly ascertain how much your portfolio has increased or decreased in a certain timeframe, but it tells us little in terms of how much risk has been attached to the investment, and how much of the return can be explained by movement in the wider market.
As a general rule, investors have a habit of looking at performance in terms of percentage gains but ignoring the risk involved in how they got there – and fair enough, this can be tricky to evaluate!
Headline gains under the microscope
Over the past 12 months we have all heard of certain stocks generating returns which most will not likely see again in their lifetime, and the same goes for funds which have performed extremely well in volatile circumstances.
Very often a stock or fund that generates exceptional returns in one year may exhibit characteristics reflecting high levels of risk, and be unlikely to replicate those returns year on year. There is nothing wrong with deciding to commit funds to an investment with these characteristics, however it is important to be aware of the level of risk which is being taken on. Most investors should be looking for investments with potential to provide consistently strong returns, for an acceptable level of risk.
The last twelve months have been a boon for investors who have been willing to take on risk in a challenging market, and access some of the more speculative investment ideas in the marketplace.
However, there are two questions to consider:
- How much of these returns can be explained simply by market timing and broad market movement?
- How do these returns look on a risk-adjusted basis? In other words, – how ‘lucky’ have some investors been when it comes to taking home double or even triple digit returns, given the risk involved?
What are risk-adjusted returns?
Risk-adjusted returns are a measure of an investment’s return that takes into account how much risk is taken on in obtaining the return.
These metrics are useful for comparing various investments, or an entire portfolio against its peers and the wider market. At a high level, a fund will have a benchmark with which it can be compared to gauge performance. In accounting for the level of risk within a fund or a portfolio, an investor is educating themselves on the role that risk plays in returns (the more risk, the greater the potential for increased gains or losses) as well as the level to which the investment has performed against its benchmark on a risk-free basis.
When an investor factors this into their calculations, they are evaluating a fund based on how much risk was taken, in order to produce a return. If an asset has a lower risk profile than that of its benchmark, the return of the asset above the risk-free rate is considered a positive. If the asset entails a higher than market risk level, the risk-free differential return is in turn reduced.
Measuring risk-adjusted returns
There are several measures of performance which take into account the level of risk. Let’s take a brief look at three of them.
The Sharpe Ratio
The Sharpe Ratio measures the return an investor is receiving for the level of risk they are taking on.
The Sharpe ratio takes into consideration the return that could have been made from a risk-free instrument like a government bond. It looks at the return from the asset in excess of the risk-free rate, per unit of volatility or total risk. Volatility is a measure of the price fluctuations of an asset or portfolio.
All else being equal, the higher the Sharpe Ratio, the more you are being rewarded for the risk you are taking and therefore the more attractive the risk-adjusted return1.
Omega ratio
The Omega ratio is sometimes used as an alternative to the Sharpe ratio. Like the Sharpe ratio, it takes into account volatility, but in addition it takes into account asymmetry of return distributions, which the Sharpe ratio does not.
The higher the Omega ratio, the more you are being rewarded for the risk you are taking, and therefore the more attractive the risk-adjusted returns.
R-Squared
R-squared measures the relationship between a fund and its benchmark index.
R-squared explains to what extent the movement of a fund can be attributed to the movements of its benchmark. For example, an R-squared of 100% would mean that all movements of a fund are completely explained by movements in the benchmark2. A high R-squared, between 85% and 100%, indicates the stock or fund’s performance moves relatively in line with the index. A low R-squared, of 70% or less, indicates the security or fund does not generally follow the movements of the index.
A high or low R-squared figure is not necessarily good or bad – it simply tells you the percentage of a fund’s price movements that can be explained by movements in its benchmark index.
Note: No single measure of risk should be used as the sole basis for an investment decision, and these calculations should be interpreted alongside other financial data and product information to come to an informed decision.
BetaShares NASDAQ-100 ETF has come out top on risk-adjusted returns
BetaShares’ NASDAQ 100 ETF (NDQ), which aims to track the Nasdaq 100 Index, recently took first place in Rainmaker’s latest RMetrics Managed Funds report, delivering the best performance in the ‘international equities high performance’ category in the three years to March 20213.
Significantly, this performance did not come as a result of taking on high levels of risk.
NDQ delivered the best performance in the international equities high performance category over this period (26.5% p.a.), but, perhaps even more impressively, also ranked first in the risk-adjusted category4.
The risk-adjusted metric factors in a range of measures and risk ratios, such as the Sharpe and Omega ratios, and ranks the funds based on an integrated risk score.
The charts below compare the NASDAQ 100 ETF (NDQ) to the MSCI World Index over the three-year period the awards covered.
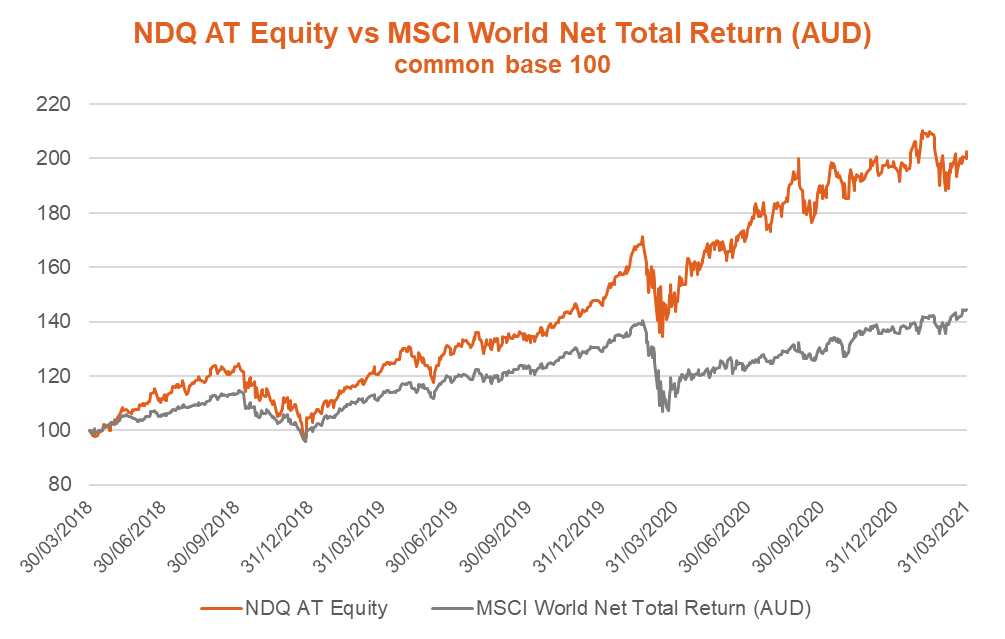
Source: Bloomberg
The table below incorporates risk-adjusted metrics.

Source: Bloomberg, BetaShares. Past performance is not indicative of future performance.
The R-Squared of NDQ vs. the MSCI Index was 77%.
Summary
While exceptional growth is always desirable, it is equally important to take into account the level of risk taken to get there in helping decide which investments to include in your portfolio.
NDQ gives access to many of the world’s most innovative companies and aims to track the price and income performance of the NASDAQ-100 Index (before fees and expenses).
There are risks associated with an investment in NDQ, including market risk, country risk, sector risk and currency risk. NDQ’s returns can be expected to be more volatile (i.e. vary up and down) than a broad global shares exposure, given its more concentrated sector exposure. NDQ should only be considered as a component of a diversified portfolio. For more information on risks and other features of NDQ, please see the relevant Product Disclosure Statement, available at www.betashares.com.au.

