
by Julian Howard – Lead Investment Director, Multi-Asset Solutions
Those of us of a certain vintage will recall the TV advert for a continental brand of beer which proudly claimed that it was “reassuringly expensive”. When it comes to richly-valued equity markets, not all investors are similarly reassured, though equally there will be some who were encouraged into their current allocations by rising prices and a fear of missing out. Valuation and pricing are often ascribed near-mythical prognostic qualities, with entire investment strategies built around the search for cheap stocks. Famous investors such as Benjamin Graham, Warren Buffett and even the economist J.M. Keynes built illustrious reputations around the idea of grabbing a bargain and watching it re-rate over time. Today, in a market where nearly everything seems expensive it is important to understand what valuations at the index level can tell us as much as what they cannot while being cognisant of the effect of prevailing interest rates on the overall assessment.
First, it is worth confirming whether markets are indeed expensive. Absolute valuation measures would certainly appear to suggest so. Here we turn to one of the most widely accepted of these, Professor Robert Shiller’s cyclically-adjusted price / earnings (P/E) ratio, or CAPE. This measures the price level of the S&P Composite Index (S&P 500 since 1957) relative to the last decade’s earnings and is adjusted for inflation. Today the CAPE stands at nearly 37 times which, while not as high as the technology boom peak of over 44 times at the end of 1999, is significantly higher than its 17 times average since January 1881. Furthermore, analysis of the CAPE through past economic troughs as defined by the National Bureau of Economic Research going back to 1885 is revealing: the CAPE was at its second-highest recorded pre-crisis level going into the Covid-19 response and is now at the highest ever post-crisis level coming out of it.
Chart 1: Looking expensive: CAPE at standout highs before and after the Covid-19 response
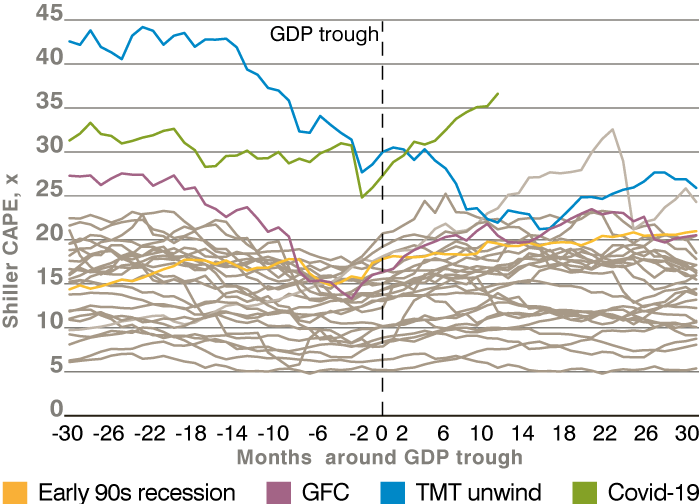
It is hard therefore to argue that stocks are cheap when viewed in the historic context. Armed with this, investors must consider what the actionable insight is. Instinctively, expensive valuations raise alarm bells of the beginnings of a speculative bubble that should be kept clear of. But the fact remains that equities have not been cheap for years, and any decision to sell on the basis that they are above long-term valuations would have been painful in terms of foregone returns. For example, by April 2018 the CAPE reached over 33 times – nearly twice the historic average mentioned – but went on to generate an impressive 57% return in the nearly three years since. This is less indicative of valuation as a metric being broken, more of one that is too often misunderstood and misapplied.
Like most financial measures and techniques, valuation tools like the CAPE have to be interpreted in the context of the prevailing economic and market environment. ‘This time is different’ came to be scorned as a hollow justification for high tech stock valuations in 2000, but there remains a fundamental truth to the fact that conditions vary and frameworks need to adjust with the times. One factor that investors should consider today when comparing elevated valuations to the historical record is interest rates. At their most fundamental, equities are legal claims to a share of the future earnings of their issuers. In order to assign a current valuation to a particular stock, investors need to make a judgement about what those future earnings look like and discount them back to the present by the prevailing interest rate. Since the global financial crisis of 2008, central banks have sought to avoid the social calamities of the 1930s and 1980s-style unemployment by loosening monetary policy aggressively in the face of economic shock. This has meant a structurally lower prevailing interest rate in recent years, in turn justifying higher prices. Elevated valuations when seen in this context should be less alarming and certainly not the bubble warning they might have been in previous cycles.
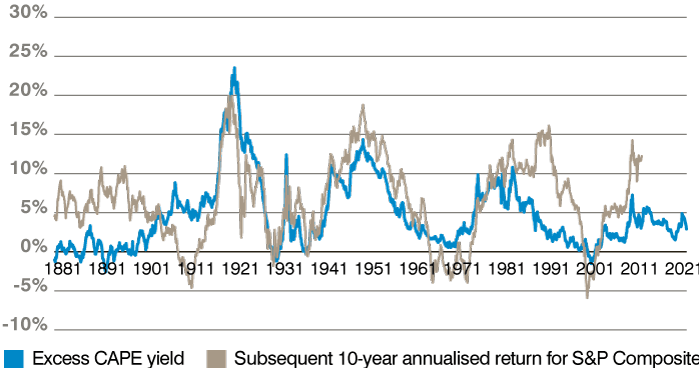
Low interest rates have not rendered valuation a redundant measure though. When adjusted for interest rates they become an invaluable guide to the general level of future expected real returns. In Chart 2, we take the cyclically-adjusted earnings yield for the S&P Composite Index and take away the 10-year government bond yield adjusted for inflation to derive the ‘premium’ equity investors enjoy over the risk-free rate. That premium is the ‘excess CAPE yield’ and has historically been a good prognostic indicator of future real returns. A high excess CAPE yield and correspondingly cheap CAPE valuation has usually led to higher returns while a low excess CAPE yield and correspondingly expensive CAPE valuation has usually led to lower returns. This relationship is what many investors would refer to as the ‘Iron Law of Valuation’ which logically states that the more you pay for equities, the less your total future returns will be, and vice versa. Today, the excess CAPE yield is 2.6%, suggesting equivalent inflation-adjusted annualised returns from the US equity market in the coming decade.
Chart 2: The real valuation message: excess CAPE a good guide to future real returns from equities
This leads to a surprising conclusion for investors. While the excess CAPE suggests equities may not offer as rosy a future as they did in recent years, they remain a viable asset class. Given the paucity of alternatives on offer in this generally expensive investment environment, investors might be forgiven for wishing to maintain their allocations to stocks, or perhaps even increase them. The yields of the major asset classes today offer a window into their future annualised returns assuming no capital appreciation. The 10-year US Treasury offers less than 1.7%, investment grade bonds 2.2%, the MSCI US Real Estate Investment Trust Index 3.4% and high yield (‘junk’) bonds 4.1%. Adjust these downwards for US core consumer price index inflation of 1.6% and potential real equity returns of around 2.6% as suggested by the excess CAPE suddenly become very attractive. Equity investors may find today’s expensive valuations almost as reassuring as that continental beer after all.

