
by Malcolm Whitten, Portfolio Manager & Senior Analyst – Tyndall AM
Dividends have recovered a third of what they were pre-COVID-19, but as the economy bounces-back, these should return to prior levels, making income generation from equity income funds look attractive compared to bonds.
Growth in dividends set to return
Earnings expectations have fully recovered the COVID-19 decline while dividend expectations have recovered only two thirds due to current conservative dividend payout ratios. Payouts should rise as the economy re-opens, confidence increases, and earnings recover. Combined with rising earnings, distributions in the hands of shareholders should increase, and as a result income generation from a diversified equity income fund looks attractive compared to bonds.
The journey last year was an adventure. It is worth reflecting on what happened to prices, earnings, payout ratios, and dividends.
The Australian market declined sharply from a February 20 high of 7160 to a low of 4536 and has since recovered to just shy of 7000 in early April 2021. The decline was driven by fears and uncertainty of the extent of the medical crisis and the economic consequence of isolation and social distancing measures intended to slow the contagious new COVID-19 virus. The severity of the share price moves was largely a function of the sensitivity to the shut-down. The recovery rally was driven by responsive health policies, Reserve Bank monetary policy, Federal government fiscal policy, and community acknowledgement of risk. Together these succeeded in cushioning the Australian economy from the negative effects of COVID-19.
Now to the potential longer-lasting economic and financial effects of policies intended to counter the detrimental effects of COVID-19. Top of the list is greater government indebtedness, input price rises (the costs that go into producing a good or service), and consequence of rising real rates (the interest rate that takes inflation into account). Markets are now reflecting the potential longer-lasting economic and financial effects of these policies.
How sustainable is the recovery?
What then is the future durability of the cash flow, earnings, and dividend recovery? Across the market, cash preservation strategies in response to the shutdown went deep, well beyond dividend suspension and cuts. A reversal in three groups of cash preservation strategies will constrain funds available to pay dividends. Re-opening of the economy will see pressure to reactivate sales and marketing plans, rebuilding inventories to meet higher sales and recommencing delayed capital spending will compete with the allocation to dividend payments.
At face value, the broad recovery in dividend payments reflected improving operating conditions as the economy has re-opened. The dividend payout ratio observed at the February company reporting season remained low versus history and reflected a cautious stance. Future durability of the cash flow and earnings rebound is a key question for investors as they shape the dividend yield expectations for the year ahead.
The recent company reporting season was notable for the high percentage of earnings beats vs misses and the rebound in dividend payouts. Australian market consensus earnings per share for the next 12 months declined 20% due to COVID-19 and held this depressed level of expectations through to September 2020 when the earnings recovery commenced. Earnings expectations have risen and just eclipsed their pre-COVID-19 level.
The recovery was due to emerging optimism regarding vaccine candidates, clarity regarding the US election result with victory to President Biden with a clear majority, and a growing recognition of the success in health and economic policy packages in containing the virus and economic effects of the shutdown.
Whilst the broad market aggregate earnings expectations have recovered the drop, the composition in terms of timing, depth of trough, and extent of rebound differed by market segment.
Similarly, for dividend expectations over the next 12 months, the extent of the dividend drought and subsequent recovery reflects industry-specific forces.
The summary tables below show the change in indexed earnings and dividends for the next twelve months (NTM) from February 2020 before the crisis, the trough, and subsequent recovery. Dividend payout ratios show their lowest point, most recent level as well as the prevailing payout ratio pre-COVID-19.
Table 1 Change in indexed earnings from February 2020
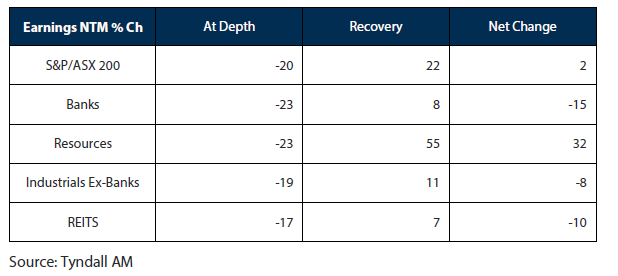
Table 2 Change in indexed dividends from February 2020
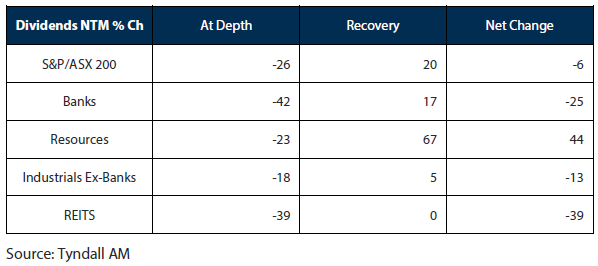
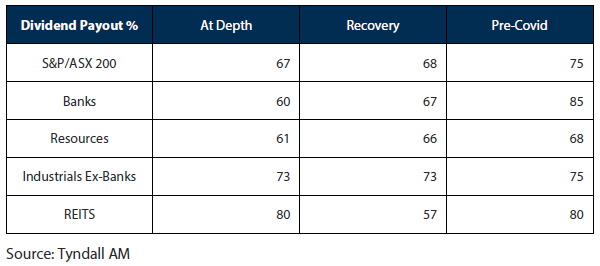
Table 3 Change in indexed dividend payouts from February 2020
The earnings decline and recovery
Each of the major market segments suffered earnings expectation declines of 17-23% from February 2020 with growing recognition that COVID-19 would have global consequences.
The first segment to recover was Resources in August 2020 and is the only sub-segment to re-take pre-COVID earnings levels and exceed pre-COVID-19 levels. Earnings expectations for the year ahead are now 32% higher than before COVID-19.
The resources sector performance has been driven by a powerful rally in the iron ore price due to ongoing COVID-19 related supply disruption in Brazil, combined with ongoing strong demand from China as they entered and emerged from the pandemic crisis earlier. A re-opening rally in the broader commodities sector including aluminium, copper, nickel, and oil has also contributed to positive resource sector earnings.
The Bank earnings expectations had been weak leading into February 2020 and fell an additional 23% in April 2020 due to COVID-19. The Bank downgrades were in anticipation of compressed net interest margin (NIM), expectations of rising bad debts, remediation charges, and charges against earnings for anticipated forward provisioning of loan losses.
Bank earnings expectations remained depressed from lows in May through to October and have since retraced 8% of the downgrades. It is noteworthy that earnings expectations remain 15% below pre-COVID-19 levels with the least amount of recovery.
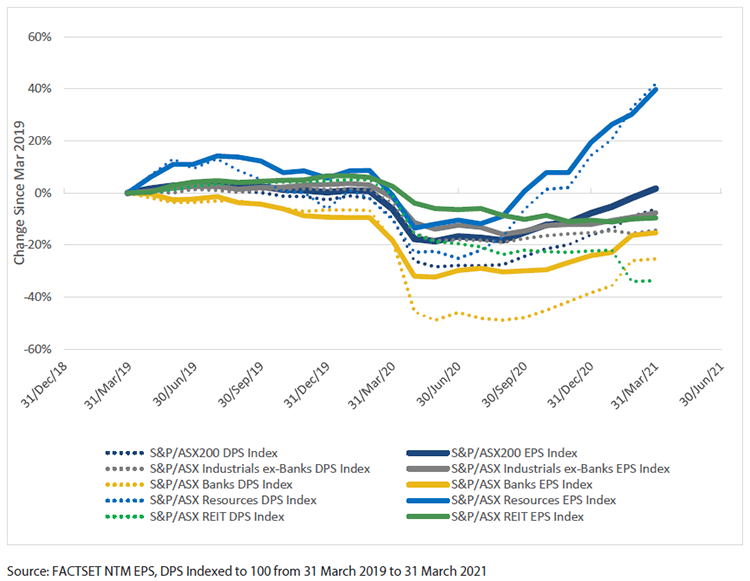
CHART 1 Earnings vs dividend – consensus estimate paths (March 2019 – March 2021 -1/+1 COVID-19 )
The dividend decline and recovery
The bluntest assessment of the impact of COVID-19 and the subsequent re-opening show consensus S&P/ASX 200 Index dividend per share expectations for the next 12 months bottomed in August 2020 having progressively declined 26% from a year earlier.
The estimated deeper dividend decline than that of the earnings decline of 20% reflected a cut to the dividend payout ratio for the same period. The subsequent recovery in earnings and dividends has not yet seen an equivalent recovery in payout ratio. The lag in payout ratio recovery is illustrated in Chart 1 where the dotted dividend index lines have not caught back up to the solid earnings index lines. The varying degree of separation for each market segment is reflective of the change in payout ratio.
Each of the broad market segments except Resources shows the dotted dividend lines below their equivalent earnings indicative of lower payouts than before COVID-19. The rising slope since August 2020 of most of the dividend series greater than earnings suggests that a recovery in payout ratios has commenced. The notable exception to this broad improvement in payouts is Real Estate Investment Trusts (REITs) where dividend expectations slid sequentially over 2020 and are now 39% below pre-COVID-19 levels.
Retail-based asset exposure within REITs face a period of downward rental reset risk. Combined with unsustainable payout ratios, and commitments to prioritize debt reduction, these factors have seen dividend expectations continue to fall, while the rest of the market earnings and dividends have begun to recover.
Office asset rent expectations have been reset lower with uncertainty regarding occupancy as CBD businesses re-configure for ongoing greater propensity to work from home. Office re-leasing spreads have opened, and incentives have been pushed out to cycle highs. The construction of new capacity has been delayed. Despite observed strength in direct market transactions, the listed market faces strong earnings headwinds.
The larger dividend payout picture is shown explicitly in Chart 2 which aggregates the rolling earnings and dividends over the last twelve months from pre-COVID to the conclusion of the February reporting season. A feature of the most recent February 2021 reporting season was one of a greater increase in dividends than earnings. Share price response to the positive dividend surprise was greater than that to earnings with the market seeming to have already anticipated the earnings strength.
Boardroom confidence in the re-opening has been signalled through raising dividends. This has been well received and suggests higher dividend payouts in the future. Forward-looking indicators of business confidence such as the NAB Business and Roy Morgan Business Confidence survey have shown rapid improvement to multi-year highs in business confidence which is also supportive of increased dividend payout ratios.
CHART 2 Dividend Payout Ratios
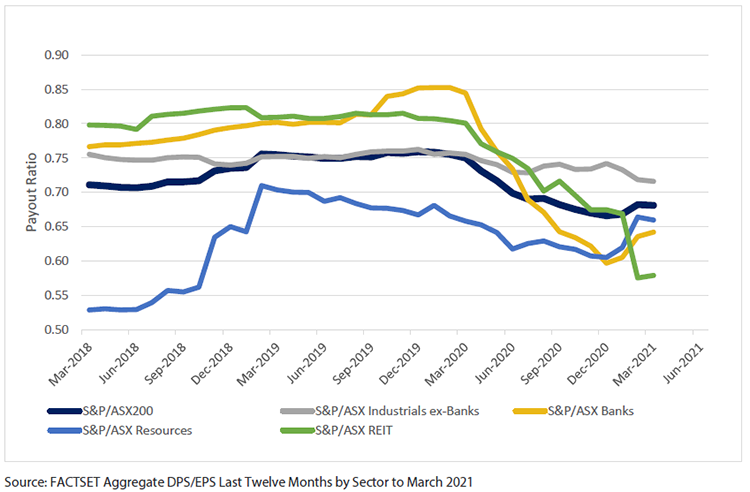
In July 2020 APRA restricted bank payouts to 50% of earnings to preserve capital due to the COVID-19 crisis. The effect of this is shown in Chart 2 with bank payouts falling the most from 85% to a low of 60%. This exceeded the limit due to the restriction being applied after CBA had already gone ex-dividend and being in force for only 5 months. The bank dividend restriction was lifted in December 2020 with APRA pointing to evidence that suspended loan repayments under emergency relief waivers have rapidly recommenced repayments.
The APRA action was a precautionary and temporary reduction in the bank sector payout ratio. This payout ratio should rise in the future in an environment of rebounding economic growth, robust housing loan growth, and benign defaults. The timing of a reversal in additional provisions taken in the face of COVID-19 is uncertain. A reversal in the precautionary provisions will boost reported earnings for the Banks.
Dividends for Resources have eclipsed their pre-COVID-19 levels. The payout ratio is already at a historically high level and less likely to increase further. Future resource dividend resilience, therefore, depends on the prevailing high commodity prices and earnings being sustained. Transitory COVID-19 supply interruptions to production in Brazil ending and new iron ore mines sponsored by the Chinese could release some tension in that market, with the latter being many years out.
The 73% payout ratio of the Non-Bank Industrials has been remarkably stable in comparison to the other segments. This group is more numerous and diversified across the industry admittedly with winners and losers from the lock-down. The meagre rise in expected earnings and dividends also reflects the many crosscurrents to the different industries within the Non-Bank-Industrials sector. For example, the re-opening and stimulus upswing in detached housing-related companies is offset by a retreat in activity from stay-at-home winners, such as consumer staples and some discretionary retail.
Path of dividend yields and outlook
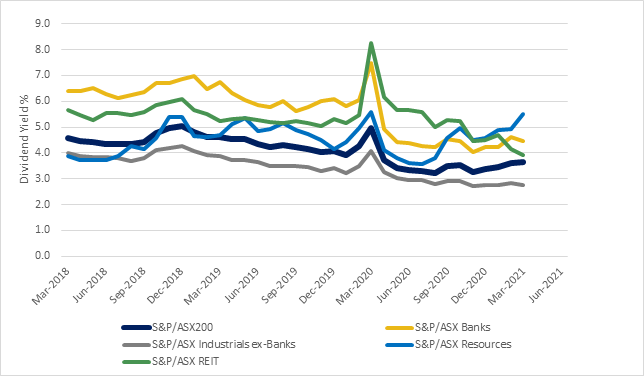
The historical path of expected dividend yields is shown for the market and major segments since March 2018 in Chart 3.
The longer-term downtrend in dividend yield has followed a greater reach for yield trade. Aside from the apparent blow-out during the worst of the March – April 2020 sell-off, combined with lagging updates to estimates and Resource earnings, the overall trend has also been for a narrowing in dividend yield. Differentiated portfolio positioning on yield alone is more challenging as yields converge.
The net effect of the potent share price rally since November 2020, and partial recovery in dividends has seen the expected dividend yields compress back to 3.7% at March 2021.
Investors should take note of the strong price gains which have far exceeded the recovery in earnings and caused compression in most dividend yields. The dividend yield of Resources currently leads the other market segments but is reliant on an iron ore price which is far above the industry cost curve and provides unprecedented incentive to add production capacity.
Chart 3 Expected dividend yields since March 2018
Portfolio positioning
A ‘goldilocks’ scenario of re-opening driven earnings growth, interest rate normalization without an inflation/wage-price spiral seem necessary conditions to support the current pricing regime. The Nikko AM Australian Share Income Fund (Income Fund) has continued to be run with the aim of generating a yield above that of the market and consistent with our comparative value analysis (CVA).
A valuation distortion brought by fears of the economic impact, a flight to safety , and a ‘stay-at-home’ focus has unwound rapidly. The outperformance of ‘Value’ over ‘Growth’ has seen the market recover much of the 2020 lost ground.
The market recovery has been predicated on the ‘Goldilocks’ recovery. If consensus is that ‘Goldilocks’ continues, any contrary evidence would see cracks appear in the recovery trade which would likely be volatile. Possible challenges to the consensus may come from delays in vaccinations, outbreaks of new virus strains, and policy stimulus withdrawal impacting growth. Alternative risks from the economy running too hot are an inflation breakout and an interest rate driven reset in asset prices. In recognition of the potential for higher volatility, risk in the portfolio has been reduced.
Conclusion
Australia has been very fortunate to have acted promptly to isolate and support those companies and individuals most affected. The dividend drought has broken. Resolve to ride out the COVID-19 episode and stick to process has carried the Income Fund well.
The composition of the market dividend yield stands at approximately 1/3 Resources. 1/3 Banks and 1/3 Non-bank Industrials. There is downside risk to Resources earnings and dividends, upside risk to Bank earnings and dividends, and a flat outlook for Non-Bank Industrials.
Consequently, the outlook for equity market dividend income looks balanced and attractive at the current level of 3.7%. The rapid and deep cuts to dividend payout in response to the crisis leave good scope for future dividend payout recovery. This sets a positive outlook for future equity portfolio income generation.
A diversified equity income portfolio can continue to provide a superior yield to 10-year government bonds which are currently yielding 1.8%. Growth in an equity income portfolio vs bonds is desirable to mitigate longevity and inflation risks.
We remain confident in meeting the rolling 5-year income objective of a grossed-up dividend yield greater than the S&P/ASX 200 Yield with an additional positive contribution to long-term capital growth from our active investment process.
The Nikko AM Australian Share Income Fund invests in a diversified portfolio of income-focused Australian shares. The Fund aims to provide tax-effective income and also the potential for capital growth.

