
Australia’s equity market performance versus global markets has waxed and waned over recent decades. As this note seeks to demonstrate, a key driver of relative performance has been relative global sector performance: in particular, the performance of technology versus mining stocks.
Long-run trends in Australian vs. global equity market performance
As evident in the chart below, Australian relative equity market performance has been through several marked cycles in recent decades. In the late 1990s, the local market tended to underperform. It then enjoyed a sustained period of outperformance from the bursting of the global dotcom bubble in 2000 until the end of the global financial crisis in late 2009. Since the GFC, the local market has once again tended to underperform.
Note, moreover, the swings in relative Australian equity performance historically have tended to be a bit wider versus unhedged global equities than versus hedged global equities. That’s because when Australian equities have been outperforming, the Australian dollar has also tended to rise – which has detracted from global equity returns in unhedged, $A terms. By contrast, when Australian equities have been underperforming, the Australian dollar has also tended to fall – which has added to global equity returns in unhedged, $A terms.

Past performance is not indicative of future performance.
Why has Australian relative equity performance shifted over time? As seen in the chart below, and at the risk of oversimplifying, a major driver appears to be the relative performance of the global technology sector versus the global mining sector. When technology has outperformed (as in the late 1990s and since the GFC), global equities has also tended to outperform. When the mining sector has outperformed (as during the noughties China-driven commodity boom between the dotcom bubble and the GFC), Australian equities has also tended to outperform.

Past performance is not indicative of future performance.
More recent performance: A shift-share analysis
Another more detailed way of understanding relative performance is by undertaking what’s known as a ‘shift-share’ analysis. This deconstructs relative performance into two parts:
- Industry effect – whereby our performance is based on our relative exposure to global sectors doing either well or poorly.
- Competitiveness effect – whereby our performance is based on the performance of local sectors compared to their global counterparts.
As seen in the table below, over the past year Australia’s market has been broadly flat whereas global markets (in hedged or local currency terms) have risen a solid 15%.
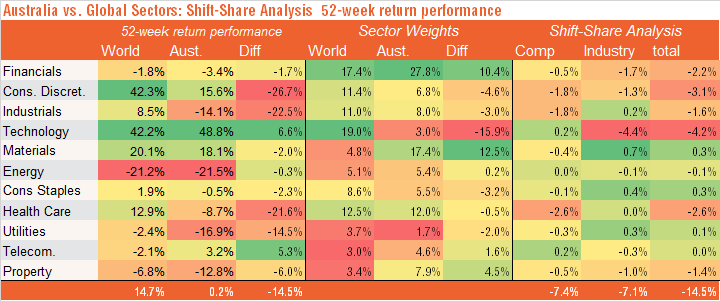
As at 5 February 2021. Past performance is not indicative of future performance.
Across sectors, the biggest drag has been technology – due to the industry mix rather than competitiveness effect. In particular, although local tech stocks did even better than their global counterparts (48.8% vs. 42.2%), local performance suffered because our listed technology sector is relatively small by global standards (a market share of 3% vs. 19% globally).
The consumer discretionary sector was also a drag, as this strongly-performing global sector has a relatively small weight in the local market and because local consumer stocks underperformed their global peers (though the latter is also partly a tech story as strongly-performing Amazon is treated as a consumer discretionary stock). Financials were also a drag due largely to poor industry mix (we have a relatively high weight in this global sector which has performed poorly over the relevant period). Other notable drags were industrials and health care due to competitiveness effects – our local sector underperformed their global peers. The healthcare drag may reflect the relatively good performance of leading global vaccine companies, and recent strength in the $A which has hurt offshore earnings of local companies like CSL.
Where to from here: technology/growth vs. resources/value?
Of course, all this begs the question: which will be the dominant global thematic over the next few years? Are we about to enter an inflationary commodity ‘super-cycle’ based on a synchronised rebound in global economic growth, which could expose commodity supply bottlenecks following years of low prices and an under-investment in new capacity? This appears to be the commodity bull case.
Or will the disinflationary global technology boom – largely in place since the GFC – continue to prevail?
My judgement is that the latter, rather than the former, will remain dominant – although commodities/resources could enjoy a short-run post-COVID bounce.
After all, commodity prices have been in a long-term downtrend, which has occasionally been interrupted by the emergence of a new industrial superpower – such as China most recently, especially after its entry into the World Trade Organisation (WTO) in 2001. There’s no new industrial superpower on the horizon that will have a similar voracious demand for raw materials.
Meanwhile, the technological revolution, encompassing growth in robotics and the shift to cleaner energy, still appears in its early stages – which could see ever greater efficiency in the use of today’s popular raw materials. Innovation will also continue to allow corporations to slash costs, which should keep inflation low – much to the misplaced concern of today’s central bankers.
Of course, I’ll be watching should trends prove otherwise – but if I’m right, I suspect Australia’s ability to outperform global peers will remain somewhat challenged given our relatively low exposure to technology stocks and higher exposure to financial and resource-related stocks.
Please note that a prior version of this article included an image from indivisiblegame.com .

