
by Scott Krauthamer and Jonathan Berkow
Investors looking for signs of an eventual return to normal from the coronavirus crisis have no shortage of signals to track. No list is exhaustive, but these data indicators, informed by big data, provide a helpful “dashboard” that paints a picture of where we stand on the road back. The text below the dashboard provides more detail on what the data is saying today.
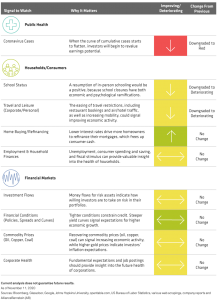
How to Read the Dashboard
Our crisis dashboard includes signals from three areas: 1) public health, 2) the consumer sector and 3) financial markets. By pulling big data from traditional sources (earnings growth and gross domestic product, for example) and nontraditional sources (like Google Trends and Glassdoor), we can create a better mosaic of the road back. Public health, of course, is the key: until there’s a vaccine, the cascading impact of the virus may continue.
The dashboard color codes (red, yellow or green) indicate the current state of each signal, while the arrows indicate the trend (improving, deteriorating or unchanged).
What’s Changed Since Our October Update?
Coronavirus cases continue to rise globally as many regions of the world begin to enter colder months. This is complicating efforts to reopen schools in many countries and spurring fresh lockdown measures across Europe and in a number of US states, including recent restrictions imposed in New York. These moves are hindering mobility and causing further pain for the travel and leisure industries. Economic activity, not surprisingly, remains subdued.
Meanwhile, Pfizer shared promising results from coronavirus vaccine testing, raising hopes for a key weapon in the pandemic battle—though one that would take time to fully deploy. The US awaits final election results: Joe Biden is president-elect, though a number of legal challenges are pending and Senate runoff elections are likely in January. This uncertainty will likely delay and complicate efforts to deliver more fiscal stimulus.
Public Health
- Globally, the number of confirmed coronavirus cases continues to rise—currently about 51 million—and deaths recently exceeded 1.2 million. While conditions are deteriorating, treatment regimens have advanced since earlier this year.
- The R0, which tracks the average number of cases spread by one person, has increased to above 1.0 globally, led by countries like the US, with an R0 of 1.2.
- US hospitalizations have risen to levels near those last seen in July, as states that previously escaped a heavy impact now face rising case counts.
Households/Consumers
School Status:
- Many US school districts are grappling with COVID-19 cases in students and faculty, resorting to shutdowns while they get the situations under control. Other schools continue to blend virtual and in-person schooling.
- Higher education’s first semester has seen mixed results, with outbreaks prompting some schools to quarantine students or send them home. According to a New York Times survey of over 1,600 US colleges and universities, more than 214,000 COVID-19 cases have been reported since the pandemic started.
Travel and Leisure:
- Airline flights originating in the US have rebounded from their lows and stabilized at about 47% lower year-over-year. China flights have continued to improve, up 2% year-over-year. However, Europe flights have declined modestly from last month, down about 70% year-over-year, as case counts continue to spike.
- In the US, “OpenTable” bookings have declined as the weather turns colder and cases rise—bookings are down 61% from last year’s levels. Similarly, global bookings have declined sharply, now down 53% year over year. Countries like Germany have returned to lockdowns, all but halting bookings, which are down 96% versus last year’s levels.
- As we enter the end of the year, vacation rentals have declined, though they remain in line with last year’s levels.
- Mobility data, particularly in Europe, has fallen dramatically as countries reenter lockdowns. For example, Germany had been up 34% year to date in September, but is now down 34%. The same is true for countries like Italy and France. Australia, on the other hand, is only down 1% from January.
- Subway traffic in China is down only about 5% relative to last year, an improved level indicating that people have started returning to public transit.
Home Buying/Refinancing:
- US housing activity remains very strong: existing home sales have risen 20.9% year over year as of September 30, a dramatic recovery after being down 11.7% year over year in June. The number of people searching for home loans is up 13% year over year.
- Building permit activity across the US remains robust, having risen approximately 15% from last year’s levels.
Employment & Household Finances:
- US jobless claims have continued to improve in recent weeks, though 67 million people have filed for unemployment benefits since mid-March. The US unemployment rate declined to 6.9% with October’s jobs numbers.
- Credit card spending data is down 5% versus 2019 levels, signaling a slowdown by the top three-quarters of consumers. The bottom quarter is still spending 10% less than last year, as they feel the absence of new fiscal stimulus.
- Election results remain uncertain. While Joe Biden is president-elect, many states continue to count ballots, and the possibility of lawsuits or recounts looms. This lack of finality will likely further delay a stimulus package to provide relief to households.
Financial Markets
Investment Flows:
- Based on Simfund data, about $49 billion has moved into bond funds over the four weeks ended October 28. Over the same period, trends in equity flows have reversed, with $7 billion in inflows.
- According to The Investment Company Institute, money-market fund assets have declined to $4.3 trillion, down from a peak of $4.8 trillion in mid-May. This suggests that investors have continued to deploy cash into fixed-income and equity investments.
Financial Conditions (Policies, Spreads and Curves):
- High-yield spreads have tightened in recent weeks to approximately 412 basis points, as measured by the average option-adjusted yield spread of the Bloomberg Barclays US Corporate High Yield Index.
- The 10-year US Treasury has risen over the last month to 0.96%.
Commodity Prices:
- Oil prices have stabilized in the high $30s to low $40s per barrel, with West Texas Intermediate Crude trading at approximately $42.
- China’s coal consumption, recovered from its lows, is up 11% versus normal levels, which indicates a pickup in economic activity.
- After several weeks of volatility, gold remains at similar levels as a month ago, trading at approximately $1,880 per ounce. Bitcoin has recently risen to above $15,000, a level not seen since late 2017.
Corporate Health:
- Per Bloomberg consensus, 2020 earnings-per-share estimates have continued to improve from their lows for both the US (based on the S&P 500 Index) and world (MSCI World Index). But the market remains focused on 2021 earnings, with US stocks trading at about 21 times earnings and global stocks at about 19 times.
Scott Krauthamer is Global Head of Product Management and Strategy at AB. Jonathan Berkow is Senior Quantitative Research Analyst and Alternative Data Lead for Equities at AB.
The views expressed herein do not constitute research, investment advice or trade recommendations and do not necessarily represent the views of all AB portfolio-management teams. Views are subject to change over time.

