
by Ilan Israelstam
The global ETF industry continued its recovery in Q3 from the market turmoil earlier this year, breaking the US$7T barrier in August before retreating slightly in September as asset values fell.
During the third quarter, the industry received net inflows of ~US$194B, with ~US$89B pouring into global equity ETFs as investor confidence recovered. Fixed income also saw significant new money, with inflows of ~US$66B for the quarter.
In this quarter’s spotlight, we focus on the uphill battle new entrants to the ETF industry face in taking market share from the incumbents.
Selected Q3 highlights are below (all flow data in $US, unless stated otherwise):
ETFs vs. traditional mutual funds: the gap widens
The global ETF industry ended Q3 2020 at ~$6.89T in AuM, up 9.7% from the previous quarter. The industry passed the $7T milestone in August, before equity markets eased in September, bringing asset values down.
The strong inflows seen in Q1 and Q2 continued in Q3, with ~$194B in new money added to global ETFs. In the year to date, the industry has received net inflows of ~$488B, up 40% from ~$349B in the first nine months of 2019.
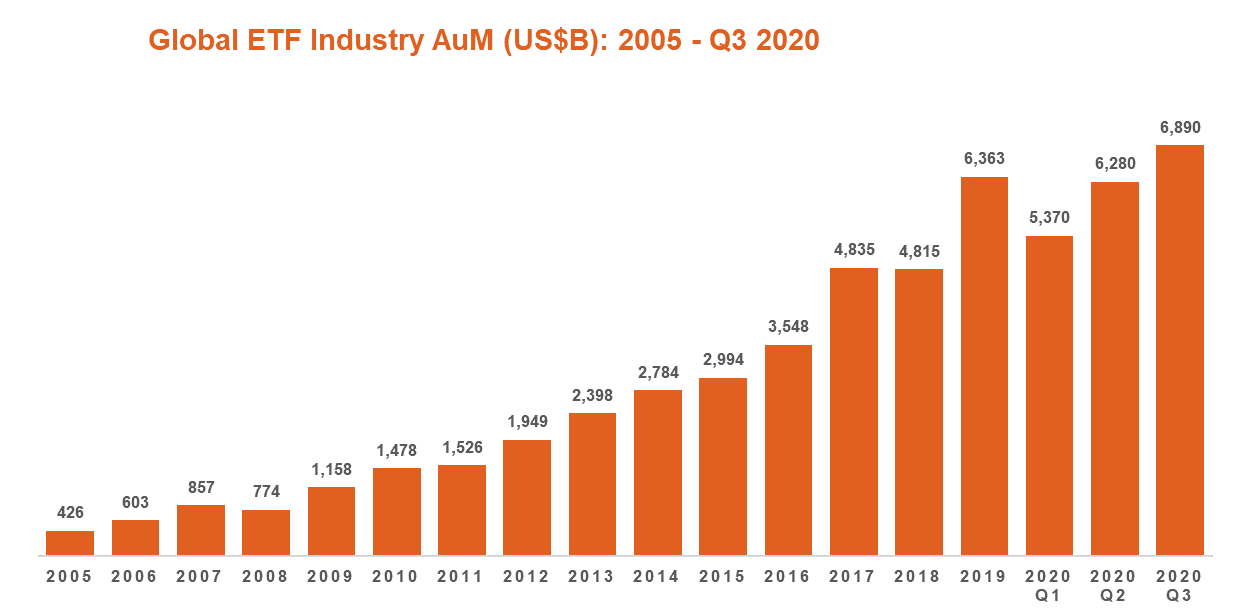
Source: ETFGI.
The investor preference for ETFs as an investment structure over managed funds continues. In the U.S., Q3 saw inflows of ~$112B into ETFs, compared to outflows of ~$7B from traditional managed funds.
The trend is particularly evident in flows into equity ETFs, and out of equity mutual funds.
The chart below shows cumulative flows for equity ETFs and mutual funds in the U.S. over the 12 months to the end of September 2020.
Over the course of Q3, ~$37B flowed into equity ETFs in the U.S., while ~$184B flowed out of equity mutual funds.

Source: Bloomberg.
Passive strategies continued to be favoured during the quarter, although the preference was not as marked as in Q1 and Q2. ~$63B flowed into passive investments, compared to ~$42B into active investments.
As in Q1 and Q2, investors looking for passive exposures turned exclusively to ETFs, with ~$97B flowing into passive ETFs, compared to outflows of ~$34B from passive mutual funds.
Investors seeking active exposures, however, favoured mutual funds, with ~$27B flowing into active mutual funds, compared to ~$15B into active ETFs.
Global ETF flows by asset class and region: equities bounce back
After a significant decline in inflows into global equity ETFs in Q2, inflows in Q3 were ~$89B, well up on Q2’s ~$20B and even ahead of Q1’s healthy ~$69B. After a rebound in sharemarkets around the world, investor confidence and appetite for risk was clearly higher than during the market turmoil in the first half of the year.
Fixed income inflows were strong, at ~$66B for the quarter. While some investors remained nervous, seeking the relative safety of fixed income exposures, flows were down from the ~$97B poured into fixed income in Q2.
The year to end September 2020 has seen ~$489B flow into global ETFs, compared to ~$349B for the same period in 2019. Of this, ~$300B flowed into ETFs and ETPs listed in the U.S., up more than 50% from the ~$197 billion gathered by the end of Q3 2019.
Equity ETFs accounted for $174B of global ETF inflows YTD, up from $133B for the same period last year, while fixed income ETFs added ~$172B, unchanged from 2019.
Interestingly, while new money into global ETFs YTD was split evenly between equity ETFs and fixed income ETFs, inflows into U.S.-listed ETFs favoured the latter, with ~$152B into fixed income ETFs vs. $100B into equity ETFs.
Aside from the increase in flows into equity ETFs, the other categories that were up strongly from the same period last year were commodity ETFs, with ~$70B YTD to the end of September, compared to ~$18B for the same period in 2019, and active ETFs/ETPs, with inflows of ~$51B, up from $29B from last year.
In terms of regional exposures, looking at U.S. ETFs, North American exposures remained the most popular region in Q3, although inflows of ~$60B in Q3 were substantially lower than Q2’s ~$113B. Global ETFs also saw healthy inflows of ~$29B, while international (Global ex U.S.) reversed Q2’s $13B outflows to post ~$18B in inflows.
At a sector level, having topped the table for the previous three quarters, Technology had to be content with second place, adding ~$6.5B in inflows in Q3. Thematic ETFs led the way, attracting ~$8.2B in new money.
The biggest reversal was seen in Healthcare, which after taking in ~$6.4B in Q2, saw outflows of $636M in Q3. Real estate continued to see the largest outflows, losing ~$2.7B in Q3 to add to the ~$2B of outflows in Q2.
Spotlight: new entrants to ETF industry face an uphill battle
In this quarter’s spotlight, we focus on the continued domination of incumbent ETFs in capturing new fund inflows, and the difficulties new funds are having making headway.
While there has been strong growth in AuM in the ETF industry, and record inflows of new money, the lion’s share has been captured by the largest issuers, in funds established more than a decade ago. New entrants are finding it challenging to break into the market.
The three largest issuers in the market now account for more than 80% of all ETF assets, and 70% of AuM are held in funds launched more than 10 years ago1.
During September 2020, of the ~$60B of inflows into global ETFs/ETPs, ~$36B (~60%) went into just 20 ETFs. One U.S. equities S&P 500 ETF gathered $3.9B alone.
The 10 largest funds, holding ~$1.3T between them, were all launched before 2013.
At the other end of the scale, new entrants face significant challenges. While ETFs launched in the last three years number almost a third of existing ETFs, they account for just over $2 of every $100 invested in the ETF industry.
Percentage of products, percentage of assets, by year of inception
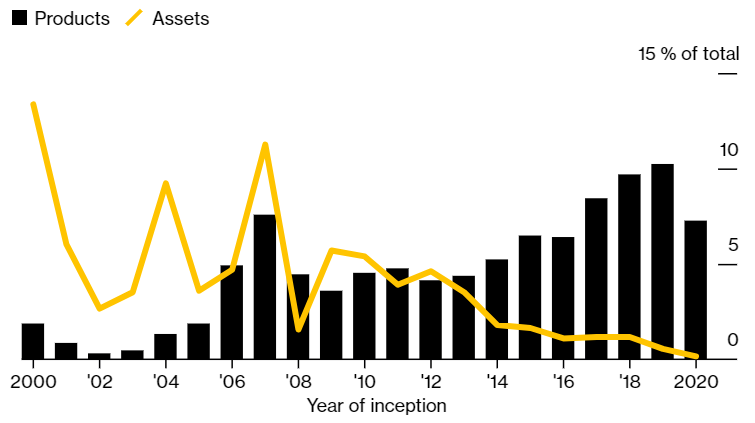
Source: Bloomberg Intelligence.
Reflecting the difficulties faced by new entrants, only 178 new funds started trading in the first nine months of 2020, placing the industry on course to match last year’s number of fund debuts – which itself was the lowest since 2014. Meanwhile, there have been more than 130 fund liquidations, already the most ever in a calendar year.
ENDNOTES
- Source: Bloomberg

