
by Michael Brown
Chatting to advisers and investors on a daily basis, a question I frequently get asked is: “Where is the money going in ETF-land?”
Given the volatility and uncertainty we have seen in the markets this year, it was interesting to pull the Year to Date (1 Jan 2020 to 30 Sep 2020) flows from the ASX.

Source: ASX monthly ETP data.
Key points:
- Aussie and International equities have dominated
- Almost all ETF asset classes have seen positive flows so far year to date
- Strong net inflows to short funds, gold and ethical exposures
Australian Equities
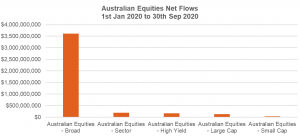
When considering Australian equities flows, there is one clear observation – broad market exposures dominated, with just over $3.5 billion in net flows. Broad market exposures are generally made up of very liquid, large companies that trade on the ASX. There may be several reasons why this asset class has seen the largest flows:
Many active managers failed to outperform their benchmarks over the past year – read more on this here
Investors are identifying value within Australian equities
Broad market Aussie equity ETFs involve less stock-specific risk than direct holdings/stock-picking
An example of an ETF within this space is the BetaShares Australia 200 ETF (ASX: A200), that aims to track the performance of an index (before fees and expenses) comprising 200 of the largest companies by market capitalisation listed on the ASX. A200 is also the cheapest Australian equities exposure in the market, with management costs of 0.07% p.a. [1]
International Equities
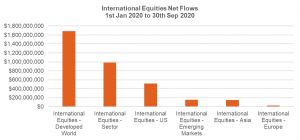
Coming in at #2 is international equities. By further breaking down the asset class, we can obtain a better understanding into the exact exposures these flows have gone into.
Firstly, ‘quality’ as a factor is a real standout from a performance perspective. Given the unprecedented times, it is no wonder quality exposures have seen flows, with around $400 million in inflows into quality ETFs to 30 September [2]. Historically, companies with ‘quality factors’ have tended to outperform the broader global market during the slowdown and contraction phase of the economic cycle, and typically have demonstrated lower volatility and drawdowns in falling markets and periods of heightened volatility [3].
Of flows into U.S. equity funds, ETFs providing exposure to the Nasdaq 100 Index took the lion’s share, with the BetaShares NASDAQ 100 ETF (ASX: NDQ) and the BetaShares NASDAQ 100 ETF – Currency Hedged (HNDQ) attracting ~$380 million in new money between them – unsurprising given the strong performance of the global technology sector so far in 2020 [4].
Fixed income
With the prevailing market volatility and uncertainty so far in 2020, it is no surprise to observe strong flows into the defensive side of the market.
For yield-hungry investors, we saw hybrids exposure obtain a large share of inflows with over $190 million. Hybrids were accessed via the actively managed BetaShares Active Australian Hybrids Fund (Managed Fund) (ASX: HBRD) that is paying a 12-month gross distribution yield of 3.9% (as at 1 October 2020) [5].
For more defensive investors, we saw strong flows into core Aussie and Global bond indices, with Australian Government bonds a standout.
Short Funds
If any statistic is going to highlight overall market sentiment, this could be the one. For those who may not be aware, BetaShares has a suite of short funds that are designed to provide a negative correlation to the market – i.e. to increase in value when the sharemarket goes down (and vice versa). At the height of the market turmoil in March and April, we saw more than $200 million in new money flow into short funds on the ASX, as bearish investors sought to profit from a falling market or hedge their current equity exposures.
To put things in perspective, as at 6 October, total funds under management (FUM) in the BetaShares short funds stood at ~$840 million, compared to FUM at 1 January 2020 of $293 million.
Gold
Given recent market volatility, and considering gold has traditionally been viewed as a ‘safe-haven’ asset, we have previously written about why there are still plenty of reasons to consider an investment in gold. Gold has seen a consistent and high level of total flows this year. Investors can obtain cost-effective exposure to gold via the BetaShares Gold Bullion ETF – Currency Hedged (ASX: QAU).
Ethical Funds
One last asset class to highlight – Ethical or ESG strategies.
This year has seen large and growing inflows into ethical ETFs with over $900 million YTD. Since December 2016, the market cap of ethical ETFs in Australia has grown over 800% (~$1.9 billion) [6].
Since the start of the pandemic, the knock-on effects of lockdown, including restricted movements of people and the shutdown of industrial activity, have had significant impacts on global carbon emissions and the way we work. Now, as we consider how best to shape the economy coming out of the crisis, ESG considerations are again coming to the forefront of investment decisions.
The range of BetaShares ethical ETFs provides ‘true to label’ ethical exposures to companies or bond issuers that are well-positioned to thrive in a more sustainable and increasingly digital future economy. These funds have also captured a large portion of total ethical asset class flows to date.
Summary
Just because an asset class is receiving large inflows does not necessary mean it will perform well. It is, nonetheless, always interesting to observe where the money is flowing into and out of, to get a sense of sentiment within the overall market, and what is resonating with different types of investors.
ENDNOTES
1.Additional fees and costs, such as transactional costs, may apply. Refer to the Product Disclosure Statement for more information.
2. Source: ASX.
3. Past performance is not an indicator of future performance of any index or ETF. Based on comparison of performance of the iSTOXX MUTB Global ex-Australia Quality Leaders Index (which the BetaShares Global Quality Leaders ETF (ASX: QLTY) seeks to track) against the MSCI World Ex Aus Index over [insert period]. You cannot invest directly in an index.
4. Source: ASX. Past Performance is not indicative of future performance.
5. Average estimated gross yield (weighted by market value and inclusive of franking credits) of the hybrids in the portfolio, divided by the current market price of the securities. Provides an indication of expected current income from making an investment at market price. This figure is indicative only and will vary over time. Not all investors will be able to obtain the full value of franking credits.
6. Market cap of ASX listed ethical ETFs from 31 December 2016 –30 September 2020. Includes the BetaShares ETHI, HETH, FAIR and GBND ETFs, and 8 ethical ETFs offered by other issuers.

