
This graphic puts gold’s ascent into proper perspective, especially in the context of gold’s retracement this week. What we are seeing is a consolidation after a period of exceptional price strength. This is to be expected – and is indeed healthy – with respect to a sustainable rising gold market. The bottom-line is that a simple retracement does not take away from gold’s overwhelmingly positive thematic.
What the graphic also underscores is that while the mainstream media might try to correlate gold’s rise with the Covid-19 pandemic, the metal’s ascent had its origins well before the outbreak of Covid-19. In fact, it began five years ago (during late 2015), when the yellow metal was trading at around $1,050 per ounce, with a subsequent price up-leg that began during August 2018, when gold was trading around $1200 per ounce. Relative to gold’s recent peak around $2,050 per ounce, gold has almost doubled in price over the past five years, and is up by two-thirds over the past two years along.
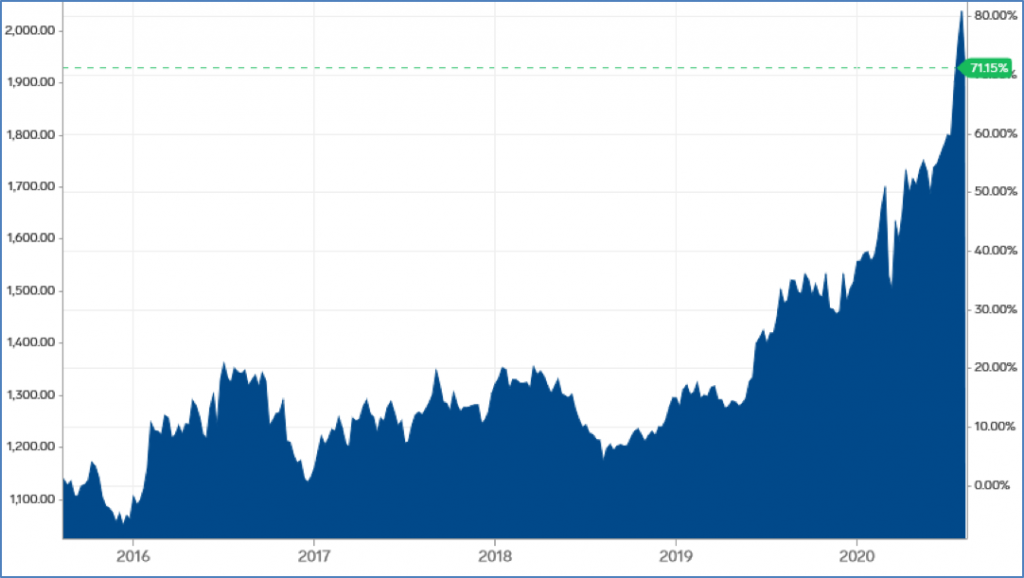
Gold’s Ascent is Not a Recent Phenomenon
Gold’s ascent began five years ago, with interest rates low and question marks beginning to be asked about the world economy. Interest rates were kept low during and subsequent to the GFC, as a means of accelerating and maintaining economic growth, but have never been allowed to return to ‘normalised’ levels. There are inherent dangers in keeping interest rates too low for too long, as they create asset bubbles and lead to artificially high equity markets, as investors chase returns.
Central banks around the world have been negligent in using artificially low interest rates to maintain growth. Furthermore, they have left themselves impotent to deal with the next economic crisis, as there is very little wriggle room to manoeuvre in terms of interest rates reductions, when rates are already at close to historically-low levels.
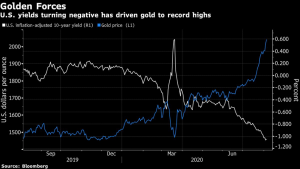
Whilst many pundits talk about the relative strength of the US dollar as being the key determinant of gold prices, the reality is that real interest rates are the primary factor. The real interest rate is the underlying interest rate after taking into account inflation. The graphic below highlights how the gold price has risen to record levels as US yields have turned negative.
So what can we expect from the world’s most important economy? The US has the potential to plunge into a period of significant stagflation, which during the 1970s represented a period of low economic growth and significant price inflation. Simultaneously, the US Federal Reserve is about to announce a major policy change of “allowing” inflation to exceed 2%, while at the same time instituting a program of “Yield Curve Control” to keep interest rates low. Putting this all together, you can be assured that real interest rates are going to move even deeper into negative territory. Many experts in the US forecast that the inflation rate could soon reach 4% – which when combined with a 0.50% nominal rate on a 10-year US treasury, would see a real rate of -3.5%. This in turn will put significant pressure on the US dollar.
More broadly there are I believe three catalysts for gold that have yet to be sufficiently acknowledged and therefore priced into financial markets.
Firstly, quantitative easing (QE) and the associated expansion of money supply, is a tactic employed by many advanced economies to stimulate growth, however emerging market economies have also begun to issue new bonds and have their central banks buy these bonds in the market, all in the name of helping to stave off a pandemic-induced financial crisis. This can erode the value of currencies on a global scale.
Secondly, fiscal stimulus to support the 2020 crisis is far larger than the stimulus used to address the 2008 GFC. The fiscal deficit to GDP in both advanced economies and emerging economies is forecasted to be larger in 2020 than the GFC, while emerging market economies’ fiscal deficits will be larger by more than double, corroborating their use of asset purchases on the market.
Thirdly, the growth of money supply and associated QE is far larger than the growth rate of gold price, and historical relationships suggest that the price of gold should play catch-up with this global growth of money supply. Apart from the US, other major countries to expand money supply to record levels and continue to print debt at levels far greater than that of the US.
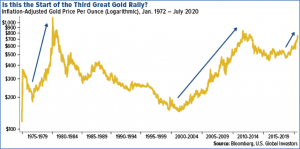
The money already thrown at the pandemic dwarfs what we saw post-GFC and the spending isn’t over yet. The trillions being fed into the financial system represents the perfect conditions for gold and silver to flourish, especially if it weakens the US dollar and leads to ultra-low yields. This could create the third great uptick in gold over the past half-century, as represented in the gold graphic below.
Uncertainty is really driving the gold price now – concerns about economic growth, do central banks have enough firepower to fix the economic mess, will it make a difference, and how long COVID-19 will last. If we reference the last major economic crisis, the GFC, we didn’t see gold’s peak until three years later. If gold prices continue to rise for another three years, predictions of $3,000 don’t seem unreasonable at all.

