
As readers will note I have been particularly bullish the past month despite the barrage of negative news and have shown how economic data like unemployment are poor forecaster of market direction. As I noted to my office colleagues – play the ball, not the man!
The reality is markets are extremely forward-looking and move at far faster rates than ever before as information is disseminated and trader positions are changed with every new data point. Gone are the days of watching a ticker and reading the paper and then ringing your broker. So it is no surprise at all that markets fall and rebound at new record rates and why comparisons to things like the 1930’s depression are just, well, idiotic. Central banks and Governments move at faster rates now to as well, reflected in how quickly central banks have moved to cut rates and implement quantitative easing. Plus for starters, we are not on the gold standard anymore and Governments are not raising taxes across the globe.
So if markets speed and newsflow has changed, what hasn’t? Human psychology and how the herd acts. I explained in my prior columns how I have made more money from applying pure market psychology than I have from any in-depth analysis across my career. Fear and greed are emotions that will always be ingrained in human DNA. So during the latest market panic and subsequent rebound, market psychology was most at play as the emotions rose to the surface. No amount of analysis could determine anything of any substance because of so many “unknowns” and still all this analysis has analysts and economists scratching their heads. How can the Nasdaq be up on the year already? We haven’t even received the worst data point yet – tonight’s US employment figures. And like all the data points that have come before this one, the market will look through it because that’s what it does.
Markets are a discounting mechanism. They first price in the worst and then discount news as it becomes reality. Nothing in the data that is being released tonight or in the past month is anything we didn’t know at the beginning of February. Moreover, is anyone honestly going to tell me that 33 million unemployed Americans is notably worse than 30 million as the market would view it?
As markets collapsed on Covid-19, what has the media been reporting (financial media included) – death, job losses, infections, shutdowns, market declines, toilet paper pandemic – anything and everything that is a sensationalized headline. And it is what we see and react to. Magicians always say – “what the eyes see and the ears hear, the mind believes”. Why do bookies make so much money? Because they bet against the public. Why? Because the betting public always gets it wrong. So seeing the public run and stock up on toilet paper as though it is the most important item in life is a prime example of Neanderthal mentality. You have to take the other side of that trade.
You saw that same mentality in the market with a huge dumping and shorting of stocks not in February, but in March and even more in April. I showed charts last week of the dash for cash. So investors liquidate equity positions, shorters positioned themselves short and then what? No sellers left. It takes lunch money to move markets back up. I gave the example in a recent column of how I tried to buy just $30,000 worth of Super Retail Group at the height of the panic. I moved the share price up 8% and got filled on zero, despite being the highest bidder repeatedly. With no sellers, there is a scramble of short covering. But the sentiment is still the same – the headlines are bad – millions are unemployed and shorters again try to re-short and those that dumped stocks are too scared to buy in.
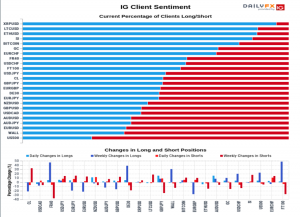
That explains why we still have sentiment and trader positions like this from IG markets published this week that the most shorted position across all their clients is the S&P 500 at 74%!
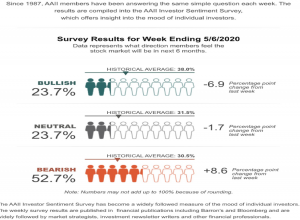
Maybe IG clients are just an anomaly……….nope. The AAII weekly survey that has been running since 1987 reflects the same thing. This survey asks investors where they think the market will be in six months. What is surprising is that the bearish views are still increasing! Up 8.6% to 52.7% versus a long-term average of 30.5%.
Even the UBS Wealth Management survey of their HNW clients showed that 61% believed markets needed to fall between 5 – 20% before they would be prepared to buy.
So the psychology works that as the market creeps higher it becomes the most hated bull market of all time. The shorters are squeezed and force prices higher. They are more aggressive than traditional long only buyers so the price moves are rapid and aggressive. Take a look at any of the US teach earnings to see the 20-30% jumps in price! This gives little weakness or opportunity for investors to buy – even in the face of all these negative headlines and data points – and they remain frustrated and “fear” they missed the opportunity. Eventually, the sidelined money has to find a home and with time the economic data passes its inflection point and the news is better. That fear now of missing out creates, even more, buying and with the Federal Reserve in the background pumping trillions, the ultimate outcome is a bubble.
Money made without drawing a single trendline or balance sheet analysis. Just pure understanding of market psychology and watching what the herd do, how they react and why under fear and duress the worst decisions are made.

