
Some commentators have been asking the question if gold is the great safe-haven that it’s made out to be, then why have we seen the price falls that we’ve witnessed over recent days?
To answer that question, let’s firstly take a look at the performance of spot gold over the past 12 months.
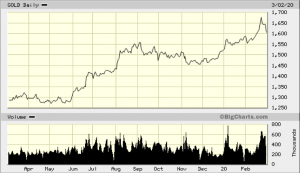
Figure 1: Gold Price Performance – 12-month Chart
The graphic reflects an outstanding price performance over the past 12 months. At the start of last week, we saw gold surging and challenging the $1,700 per ounce price level for the first time since December 2012. A remarkable achievement when everything around it was collapsing due to coronavirus fears.
The latter part of last week saw a significant retracement in gold, but even taking this price retreat into account, as I write this piece the gold price at $1,605 per ounce is still up $312/oz – or a whopping 24% – on where it was this same time last year.
This is not a bad outcome for an asset that according to some has reportedly lost its safe-haven lustre!
Now, for even better perspective let’s compare gold’s 12-month performance versus the Dow Jones Industrial Average (DJIA).
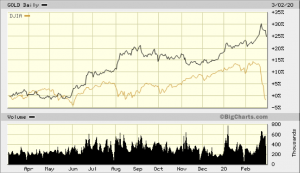
Figure 2: Gold Price Performance v DJIA – 12-month Chart
Once again, we can clearly visualize from the graphic above how well gold has performed relative to the major US share index. In fact, it’s a no-contest – and gold’s recent correction is a blip on the radar screen.
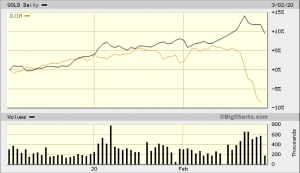
Figure 3: Gold Price Performance v DJIA – 3-month Chart
The relative outperformance of safe-haven gold is even more pronounced when we take a look at a three-month chart of the relative performances of gold and the DJIA, above. What this is telling us is that gold is outperforming major equities indices on both a longer-term and short-term basis.
Why Sell Gold?
In this extremely volatile market environment, no investment is immune from a sell-off or profit-taking, not even gold. And let’s not forget that one of the major reasons as to why investors hold gold is that it is an insurance policy – which can be called upon or liquidated – all or in part – as required in times of crisis.
Margin calls elsewhere in the market dictate that financial assets need to be sold. Inevitably therefore, when investors have already liquidated part or all of their equity holdings that have fallen at a much faster rate, they will then look to liquidate portions of their gold holdings.
It can therefore be argued that gold is fulfilling its role as a safe haven – and yet is still well up on where it was a year ago. This tells us that gold’s fundamentals remain overwhelmingly positive and any near-term price corrections aren’t significant in terms of the bigger picture.
A Strong 20-Year Trend
While gold came close to touching the $1700 per ounce mark last week – it’s highest level in seven years – from a bigger picture perspective it is a reflection of a much broader gold price run that began back at the turn of this millennium. The bull market in gold began in the early 2000s, not long after many of the world’s central banks (including Britain and Australia) had sold much of their gold reserves. What this 20-year chart of the gold price does is put its longer-term performance into even better perspective.
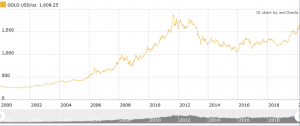
Figure 4: Gold Price Performance since 2000
Australia was a particularly interesting case in point, given that it has traditionally been one of the world’s major gold producers and exporters. Back in 1997, then-treasurer Peter Costello agreed to sell most of the nation’s gold holdings. The decision prompted cries of betrayal from the gold industry – and with the benefit of hindsight – was incredibly poorly-timed. Since the sale of 167 tonnes of gold for $2.4 billion, or just over $400 an ounce, gold in Australian terms has rallied to record highs. The price is currently around $2,450 ounce, so the gold that was sold for $2.4bn would now be worth $14.7bn.
Price Outlook
Referring back to our 12-month gold price chart, we see that gold’s recent price strength began during June 2019, when it rose above critical technical resistance and well above key moving averages.
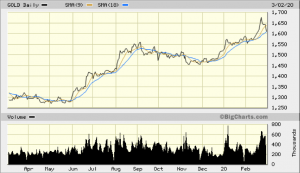
Figure 5: Gold Price Performance – 12-month technical chart
While $1700 is a psychological level in the gold market, the next technical target will be between $1785 and $1805, the peaks from the final quarters during 2011 and 2012. The next step would then be gold’s all-time high at $1920.70.
At this week’s Prospectors and Developers Association of Canada (PDAC) 2020 conference in Toronto, Nicky Shiels, commodity strategist at Scotiabank, declared in her presentation that “Gold was back in vogue,” and embarking on a new uptrend – with the only question being the trajectory of the uptrend for 2020. In terms of prices, Scotiabank has increased its forecast for the year, with prices pushing to $1,750 an ounce and averaging $1,625 an ounce for the year. In the medium to long term, Shiels noted that there is a possibility that prices can rally to $1,900 an ounce.
The bottom line is that the fundamental drivers for gold remain in place, reinforced by the spreading coronavirus. This is likely to mean that we will see an increasingly dovish US Federal Reserve stepping back into the market with renewed stimulus measures and lower interest rates – which in turn will lead to a weaker US dollar and reinforced support for gold prices.
Bear in mind too that ETF gold holdings are currently at record highs. Encouragingly too, gold has reached new record levels in almost all currencies around the world except for the US$ and Swiss franc.
So, the bottom-line is clear – media commentators that question gold’s safe-haven status clearly haven’t done their homework. Even taking its price retreat into account, the gold price is strongly up on where it was this same time last year and had dramatically outperformed equity markets.

