I don’t know what it is, but history has proven that every time I am on holiday, markets either become more volatile or more difficult. It has become a running multi-year joke in the office now that if “GT” goes on holidays it is compulsory to buy put options. It is to the point that to actually have a holiday I have to sell all non-core holdings to actually have a break. So it’s no surprise that this week’s volatility has come while I am (trying to) relax up in sunny Palm Cove.
Back in August, I highlighted several reasons and developments that were increasing my concerns for markets over the notoriously volatile months of August to October. Many of those factors still remain and while this week has seen a steep drop, I am not convinced we have seen the end of the selling pressure. There are too many overhanging variables that just overwhelm the only underlying positive out there – low-interest rates. In our morning meetings, I have said that the only thing that could possibly save this market from some sort of volatility spike would be if the Federal Reserve cut by 50 basis points. This is an extremely unlikely scenario, because they are still as a whole still very much reluctant to reduce rates, instead calling them a “mid-cycle rate adjustment”.
When you have a Federal Reserve that is behind the curve during a trade war, you get the worst manufacturing data in a decade. That ISM manufacturing data released this week was a shocking number and to me confirms all my reasons for why I have been a bond bull since the end of 2018. I called it one of my trades of the year – they were just so mispriced compared to my assessment of the global economy. And yet still the Fed is being dragged kicking and screaming to more rate cuts.
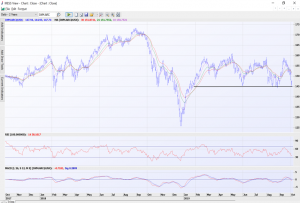
The poor data pulled the rug out from underneath equity markets this week and that key supporting trendline on the NASDAQ-100 chart has now broken (below).
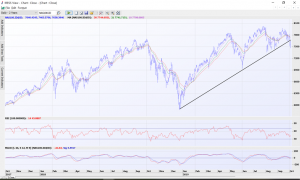
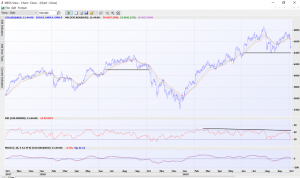
The Russell 2000 ETF hasn’t broken down through support at $145, but is on the brink of doing so. The more attempts at this support level the more likely it is to break (just like the NASDAQ trendline above). Given the Russell 2000 is a collection of mid-cap domestically focused companies, it is more vulnerable to poor economic data. Once this $145 support level goes, it could be in for a quick 5-10% decline. Not a lot of support exists under $145!
There is still an ongoing rush into bonds across the entire duration curve, with US 2-year bond yields hitting new multi-year lows last night. While the move into Government bonds is strong as a safe-haven, the high yield corporate bond market is seeing an exodus. Recall in my article on the signs I look for when assessing possible danger for markets, I referred to the corporate bond market. I use the HYG ETF or ANGL ETF for a broad view of this market and when it diverges (investors sell corporate bonds) from US Government bonds – it is a worry. A big one. We are witnessing that now with the past week the HYG and ANGL ETFs in decline. They are yet to take out support levels, but this early sign still tells me to be cautious and if it continues, the probability of a sudden sharp equity market drop rises. Equity markets are almost always the last to react.
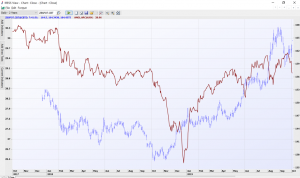
Below I show US Treasuries (in blue) overlayed with the ANGL ETF and there are a few clear cases where Treasuries rally and the ANGL ETF declines. First in Nov-Dec of 2018, next in May 2019, in August and now. In each of these cases there has been a meaningful decline in equity markets. This is another reason for me to cautious, as investors sell lowly rated corporate bonds on fears that an economic slowdown will possibly see some companies struggle to repay bondholders.
One other factor that concerns me is the performance of the stocks that contributed to the rise of equity markets – namely the big tech heavyweights. The statistic goes something like this, 80% of the NASDAQ-100 increase in the past few years has been the result of just 5 or 6 companies. Namely, Microsoft, Amazon, Facebook, Apple, Netflix, Google. These stocks don’t look crash hot anymore and recall my article two weeks ago on why I am shorting Netflix and the video streaming stocks? Netflix has dropped 15% and Roku plummeted 29%. There is still more to come given NFLX is still on an earnings multiple of 100x.
Correlations are also increasing with global equity indices following the same path lower this week. European and Asian markets all dropped this week, with Germany and China positing poor economic data this week as well. Let’s not forget that Trump postponed tariffs on consumer goods being imported into the USA until later this year. That deadline is quickly approaching. Will he postpone again? Will a trade deal be secured before then? I think the latter is unlikely and the former will only be a mild reprieve in the long-term growing concerns of the impact of tariffs.
Finally, what does this mean for the ASX 200? The RBA rate cut this week is not being entirely passed onto borrowers and loan volume growth is still being hampered by the stringent approval process. Elsewhere the economy is still struggling on the back of consumers that are reluctant to spend. The rally in retailers make them vulnerable to profit taking as tax refunds are falling short of expectations. It seems the only place seeing any hope is pockets of the housing market, in desirable areas as long as its not in apartments. There is still a massive supply of apartments to hit the market in the next 6-18 months.
Despite a steep drop this week, indicators are not yet at oversold levels. Nor has there been enough ‘panic and fear’ that accompanies market lows. To me this spells, along with chart patterns, that there is still more selling to come. At this point I can still make a case for levels back towards 6200 – another 300 points lower.
As a result, I still remain cautious and maintaining just my core key long-term mid-cap holdings. Plus I am still on holidays for another week. Mark it down in your diaries and I promise to warn everyone next time I do go away……
NEW – Greg Tolpigin’s Million Dollar Trader
Greg has just released his brand new 141-page eBook “Creating Wealth From Explosive Stocks”.
Learn how to identify stocks that are poised to increase 50%, 100% and even 500% in value and invest right as they begin to take off.
This educational path to profitable trading cuts away all the theory and hundreds of “historic examples” and uses only real trades Greg has used as a strategist and proprietary trader for the major US and Australian investment banks and continues to apply today.
Join the Million Dollar Trader club today to download your copy of “Creating Wealth From Explosive Stocks” plus watch the weekly video to learn how Greg has applied these strategies to continually identify new opportunities.