
Westpac, ANZ and NAB recently announced their results, while CBA gave its third quarter trading update. The market’s reaction, for the most part has been swift with the banks being punished by investors on the days of their announcements. The worry for investors was in the detail.
Despite rising rates, each of the bank’s net interest margin (NIM) appears to have peaked because competition has led to the banks squeezing their margins on home loans and with an economic downturn on the horizon there are fears that impairments could rise. The Australian share market movements over the past week highlight the concentration risks inherent in the Australian market – financials make up over a quarter of the S&P/ASX 200. Such sector bias makes sense if you are bullish on the sector, but the market’s reaction and the banks’ own talk about being ready for a downturn make it clear that pressures on banks will remain: margins are under pressure, the economic outlook is not conducive to growth and defaults are expected to rise.
VanEck Australian Equal Weight ETF (MVW) is a portfolio construction solution that reduces concentration risk to banks and can be deployed to help de-risk and diversify with no one security or sector dominating, providing a more balanced exposure to Australia’s economy.
When Australian banks report
You can see in the chart below the share price performance of Australia’s big four banks since the beginning of the month. Even though the banks are delivering record results, the price of all the banks have fallen immediately after the release of their results or updates.
Chart 1: Share price performance of the big 4 banks, 1 May 2023 to 9 May 2023
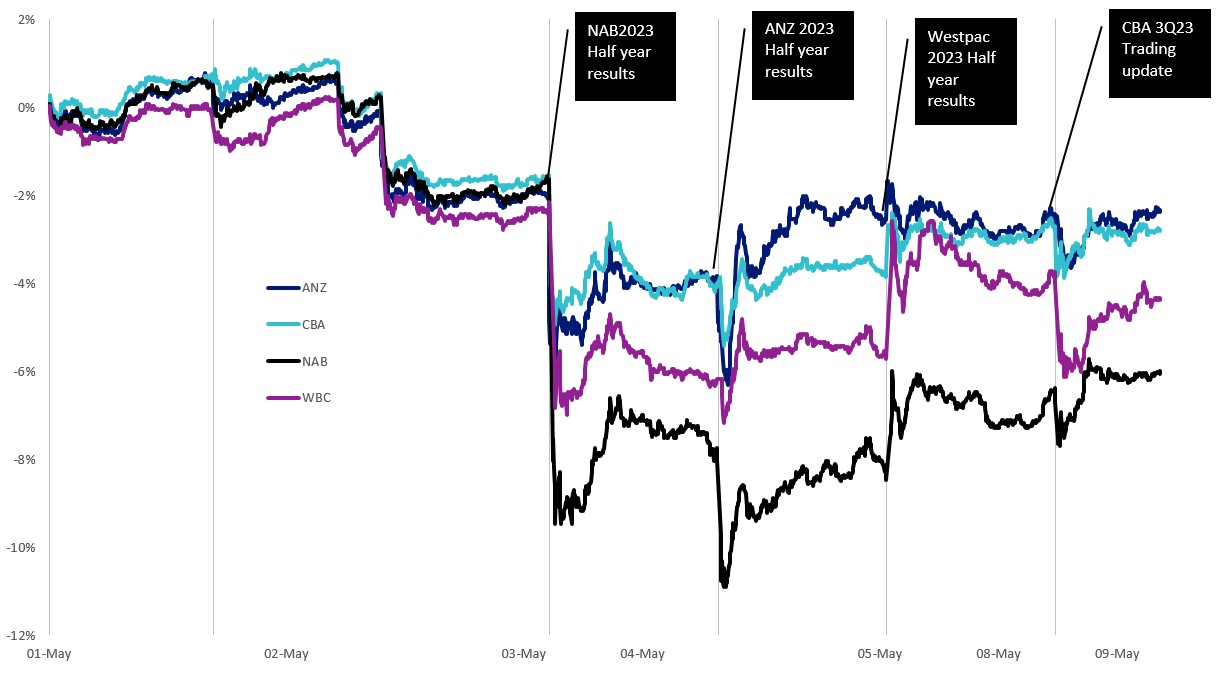
Source: Bloomberg, price returns. Not a recommendation to act.
Earlier in the year, after CBA reported, it was becoming evident that unlike in previous rate rising environments, bank margins were not expanding. Results this past week confirm that margins may have peaked.
The strong competition for deposits and mortgages and increasing costs have resulted in predicted falls in the NIM for the rest of 2023. NAB indicated a five basis points quarterly NIM contraction (From 179 basis points to 175 basis points). Westpac’s NIM was flat compared to the last half year and ANZ’s was up but only by seven basis points compared to the last half year. This follows CBA’s February results that suggested that its NIM peaked in October 2022. The heady days of 200 basis points NIM appear to have passed.
Chart 2: NIMs Banks reporting in May
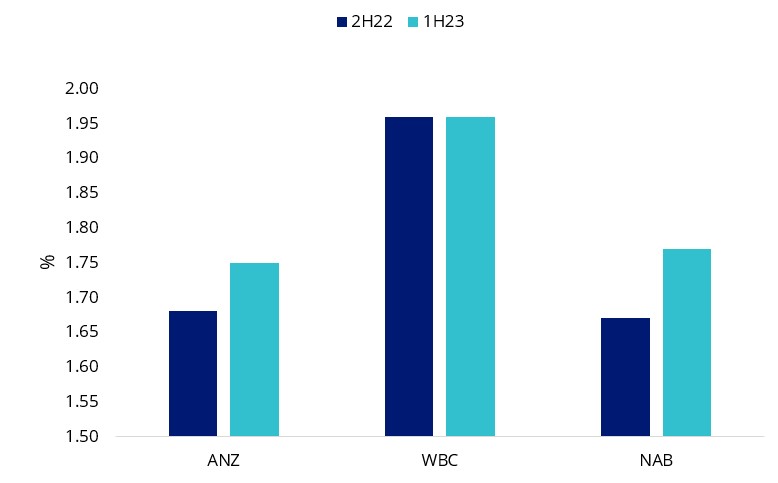
Source: Banks’ Half year results; VanEck
Chart 3: Major Banks’ Net Interest Margin* (Domestic, half yearly)
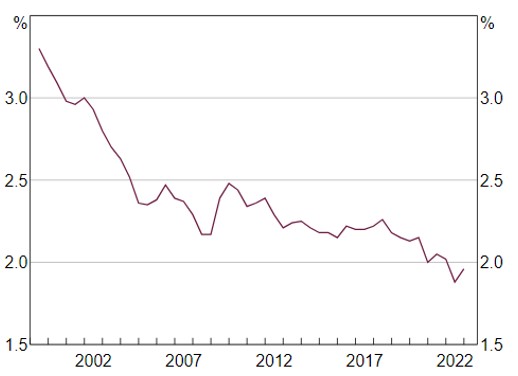
Released on 3 May 2023 (data updated to 27 April 2023). *Data for a given period relate to banks’ public profit reports released in that half; IFRS basis from 2006, AGAAP prior, excludes St George Bank and Bankwest prior to the first half of 2009. Sources: Banks’s financial reports; RBA.
Costs including wage inflation are limiting the expansion of bank profits. Looking forward, the significantly higher interest rates will see loan growth continuing to slow and bad debts increase. Competition for both mortgages and deposits have never been more intense.
The “mortgage cliff” of fixed rate loans expiring will start having an effect this quarter, with 222,800 expiring over the June quarter and then another 392,000 expiring by year end. Larger loan repayments could force home borrowers on the margin to default on their home loan repayments.
Chart 4: Fixed-loan expiries (% of home loans outstanding)
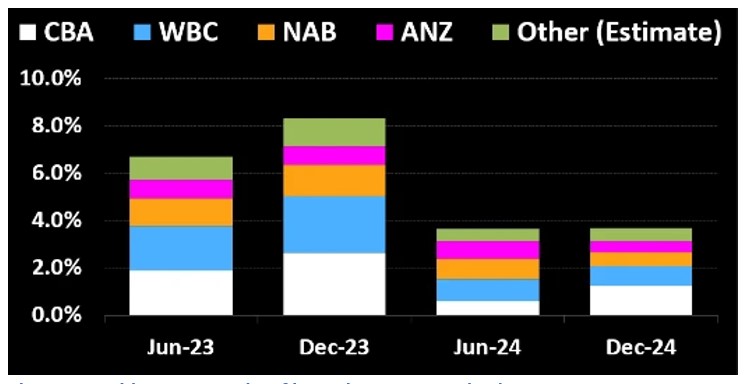
Source: Company filings, APRA, Bloomberg Intelligence
Although the banks have been increasing their loan loss provisions to consider the weaker economic outlook they fall short if the RBA cash rate increases more than expected or the economy deteriorates more quickly or more severely than expected.
Reducing concentration risk
We are not saying sell or short Australian banks, we are just highlighting it may be a risk into the rest of 2023 if your portfolio is overexposed to them. Most Australian equity portfolios benchmarked to the S&P/ASX 200 are likely to have an exposure to the big 4 banks around the 25% range because that is their representation of the benchmark index. Such an allocation only makes sense if you are bullish on the sector but the past week’s results, the market’s reaction and tepid guidance highlight the headwinds facing Australia’s largest financial institutions.
The VanEck Australian Equal Weight ETF (MVW) currently has less than 5% exposure to the big four banks. It is designed to be a low-cost core allocation around which ideas can be added.
MVW vs S&P/ASX 200 Index – A more balanced approach
The index MVW tracks, equally weights the largest and most liquid stocks on the ASX at each rebalance. Because of this, at last rebalance, no company was more than 1.19%. What this means is that if ANZ or CBA goes up or down 5%, its impact on the S&P/ASX 200 is greater than it is on MVW.
A consequence of the equal weight methodology is that MVW, relative to the S&P/ASX 200, is underweight those sectors that contain larger than average companies. For example, MVW is currently underweight the financials sector by 9.45%. Conversely it will be overweight sectors that contain smaller than average companies. MVW is currently overweight industrials by 6.28% and information technology by 2.23%. Therefore, MVW has less sector concentration risk than the S&P/ASX 200.
Chart 5: S&P/ASX 200 and MVW Index sector weightings
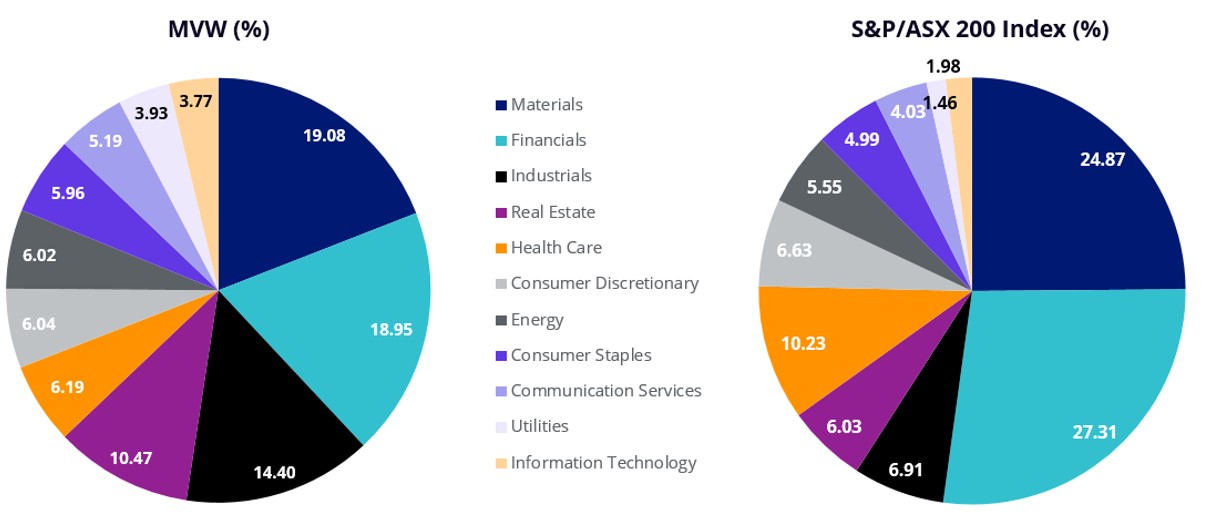
Source: FactSet, 30 April 2023
If you have MVW as a core Australian equity portfolio and you believe the economic environment will become favourable for banks, you can add to your MVW portfolio by buying your preferred bank directly as a satellite position. Alternatively, you could consider the VanEck Australian Banks ETF. In this way ETFs are efficient tools to express portfolio ideas for the prevailing economic environment.
Irrespective of the stage of the economic cycle, MVW is designed to be a long-term portfolio solution as an alternative to an active manager or an S&P/ASX index tracker. In the current environment it has outperformed the S&P/ASX 200, as evidenced by its recent performance. Over the long term too, MVW has outperformed. Since its inception in 2014, to 8 May 2023, MVW has outperformed the S&P/ASX 200 Index by 174 basis points per annum. As always, past performance is by no means a reliable indicator of future performance.
Chart 6: Cumulative performance: MVW versus S&P/ASX 200 Index since inception to 11 May 2023
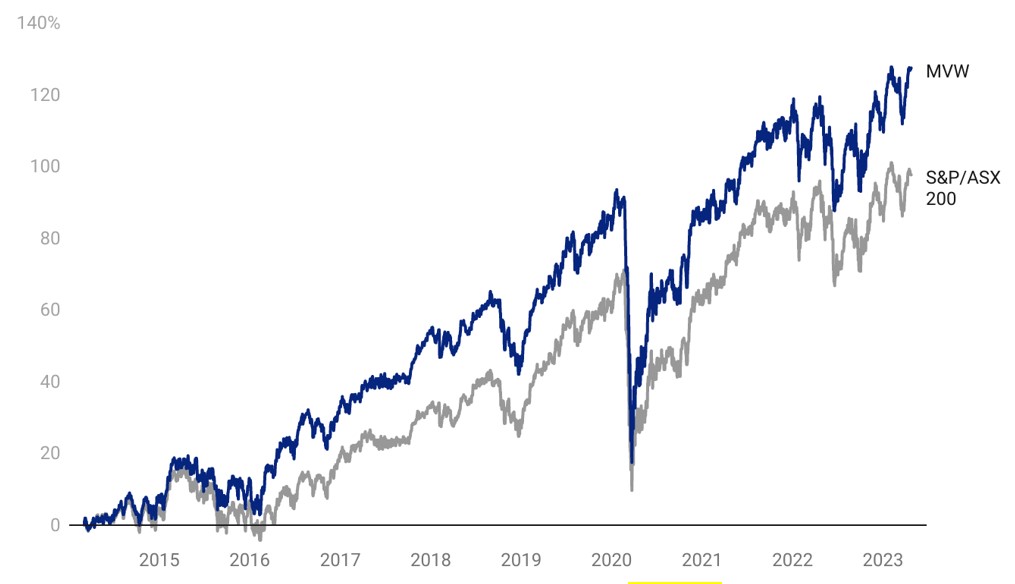
Table 1: MVW Performance to 11 May 2023
|
MTD (%) |
1 mth (%) |
3 mths (%) |
YTD |
1 yr (%) |
3 yrs (% p.a.) |
5 yrs (% p.a.) |
7 yrs |
Since inception (% p.a.) |
|
| VanEck Australian Equal Weight ETF (MVW) |
0.54 |
1.04 |
1.89 |
7.13 |
10.98 |
15.06 |
7.76 |
9.23 |
9.35 |
| S&P/ASX 200 Accumulation Index |
-0.54 |
-0.54 |
-0.77 |
4.80 |
7.40 |
14.20 |
7.67 |
8.70 |
7.61 |
| Difference |
+1.08 |
+1.58 |
+2.66 |
+2.33 |
+3.58 |
+0.86 |
+0.09 |
+0.53 |
+1.74 |
Inception date is 4 March, 2014.
Chart 6 and Table 1: Source: Morningstar Direct, VanEck. Results are calculated daily and assume immediate reinvestment of all dividends. MVW results are net of management fees and other costs incurred in the fund but do not include brokerage costs and buy/sell spreads incurred when investing in MVW. Past performance is not a reliable indicator of future performance. You cannot invest directly in an index. The S&P/ASX 200 Index is shown for comparison purposes as it is the widely recognised benchmark used to measure the performance of the broad Australian equities market. It includes the 200 largest ASX-listed companies, weighted by market capitalisation. MVW’s index measures the performance of the largest and most liquid ASX-listed companies, weighted equally at rebalance. MVW’s index has fewer companies and different industry allocations than the S&P/ASX 200.
We recently released a white paper analysing MVW’s performance in the three-year period following the sharp sell-off across equity markets in March 2020, as well as three other periods of recovery. The findings can be found here – The road to recovery (revisited): Further analysis of equal weight performance after market declines.
Key risks
An investment in the ETF carries risks. These include risks associated with financial markets generally, individual company management, industry sectors, fund operations and tracking an index. See the PDS for details.

