
Most Australian investors have an allocation to Australian small caps, yet the performance may not match the expectation, with the asset class hamstrung by structural nuances. Unlike Australian small companies, global small caps have historically demonstrated outperformance relative to large companies over the long term.
The overlooked asset class
Research has shown most Australian investors are missing out on the potential benefits international small companies can add to a portfolio. This is not because Australian investors are apprehensive about investing in small companies. On the contrary, local investors pile into Australian small companies with zeal, attracted to the potential growth prospects of the ‘size effect’. The size effect is essentially the tendency of small companies to produce higher average returns than large ones over the long-term.
According to a review of Morningstar data, 17% of all money invested in Australian equity funds (ex ETFs) in Australia are invested in small companies funds. This compares with just 2% of all International equity funds (ex ETFs) being invested in international small companies.
This is surprising when you consider the different opportunity sets and the better relative performance of the ‘size effect’ in overseas markets. The ASX represents less than 2% of the developed global share market, hence the appeal of adding international equities to a portfolio.
Another anomaly an Australian investor must contend with is that the alpha evident elsewhere in the world is not evident in local small-cap indices. The S&P/ASX Small Ordinaries Index has delivered lower cumulative returns relative to the broader Australian equities benchmark since 1998.
Chart 1: Cumulative historical performance of Australian small-caps and broader benchmark
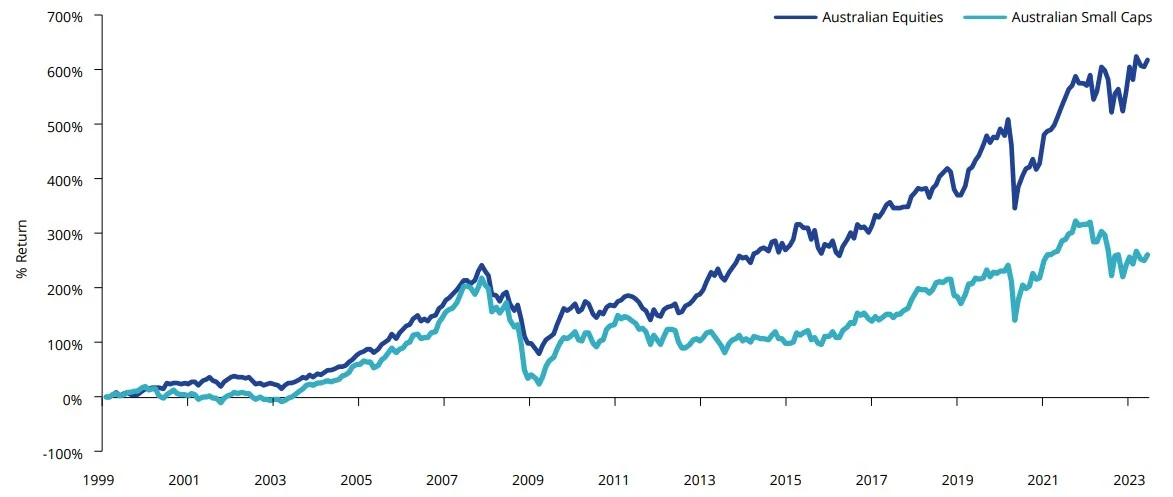
Source: Bloomberg, Australian Equities is S&P/ASX 200, Australian Small Caps is S&P/ASX Small Ordinaries, 31 December 1998 to 30 April 2023. Past performance is not indicative of future performance. You cannot invest in an index.
Unlike Australian small companies, global smaller caps have historically demonstrated outperformance relative to large companies over the long term. Below is the cumulative performance of MSCI World ex Australia versus MSCI World ex Australia Small Cap index.
Chart 2: Cumulative historical performance of global small-caps and broader benchmark
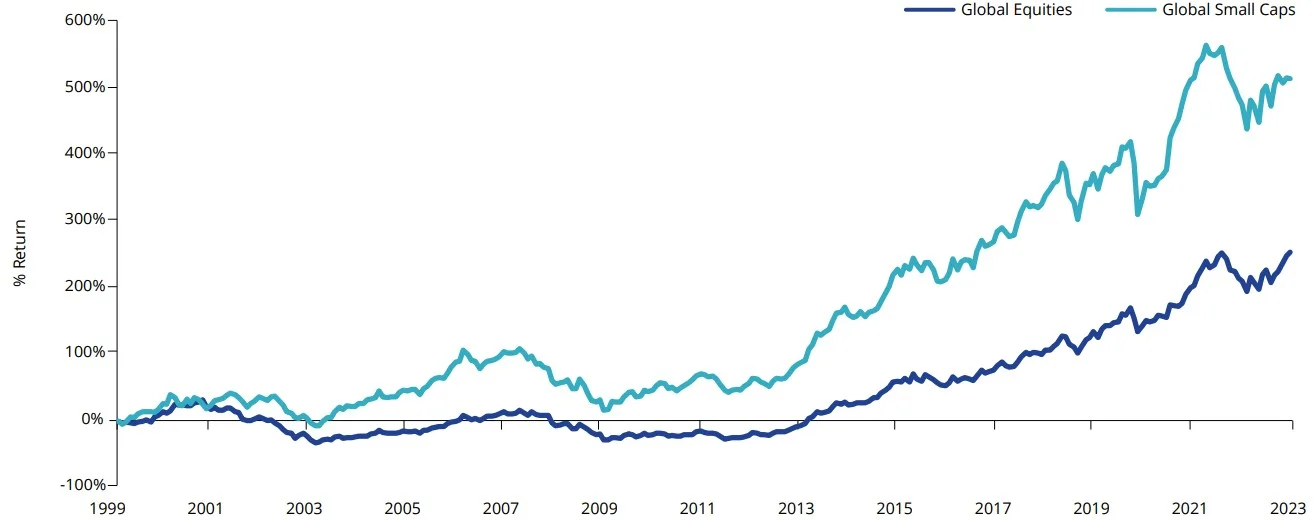
Source: Bloomberg, MSCI, Global Large Caps is MSCI World ex Australia Index, Global Small Caps is MSCI World ex Australia Small Cap Index. 31 December 1999 to 30 April 2023, returns in AUD terms. Past performance is not indicative of future performance. You cannot invest in an index.
What’s in a name
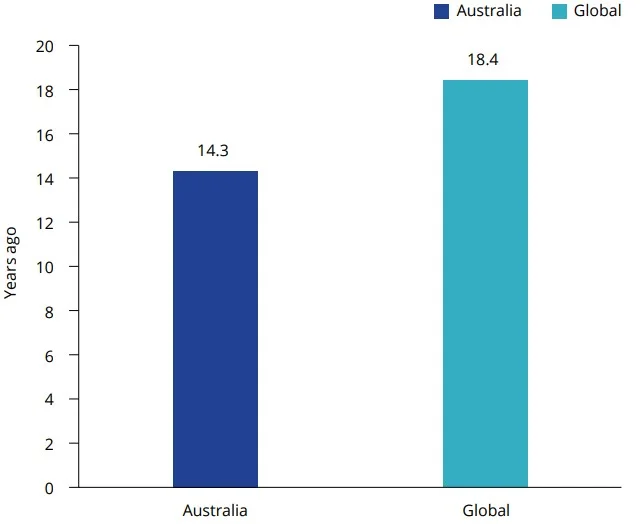
Local investors might be surprised to learn that global small-caps, in the context of market size, would be characterised as mid-caps in Australia when measured by market capitalisation.
Chart 3: Index coverage by market capitalisation
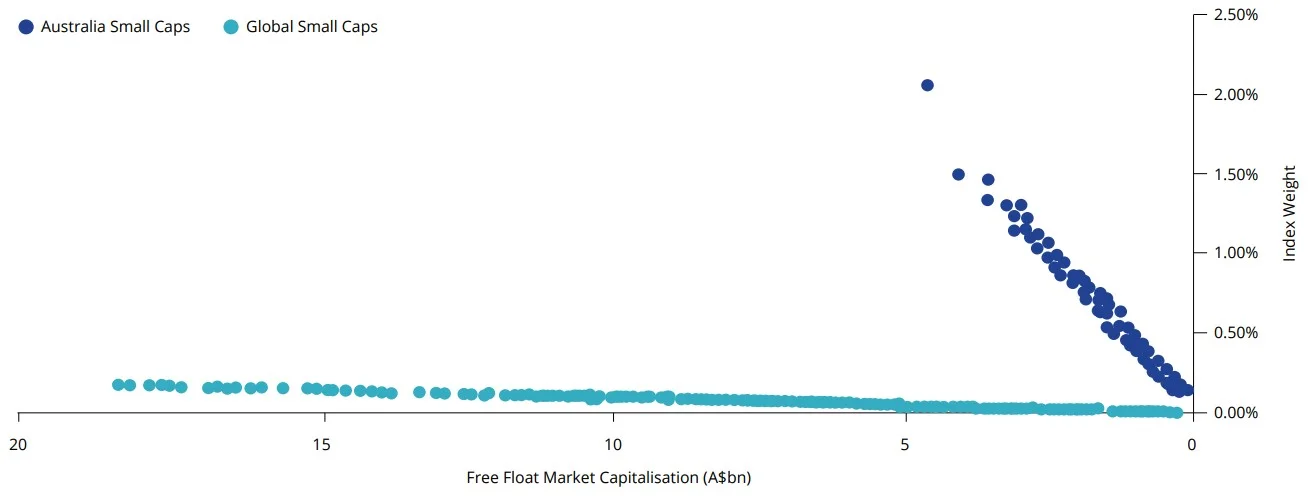
Source: S&P, MSCI, as at 30 April 2023. Australian Small Caps is S&P/ASX Small Ordinaries Index, Global Small Caps is MSCI World ex Australia Small Caps Index.
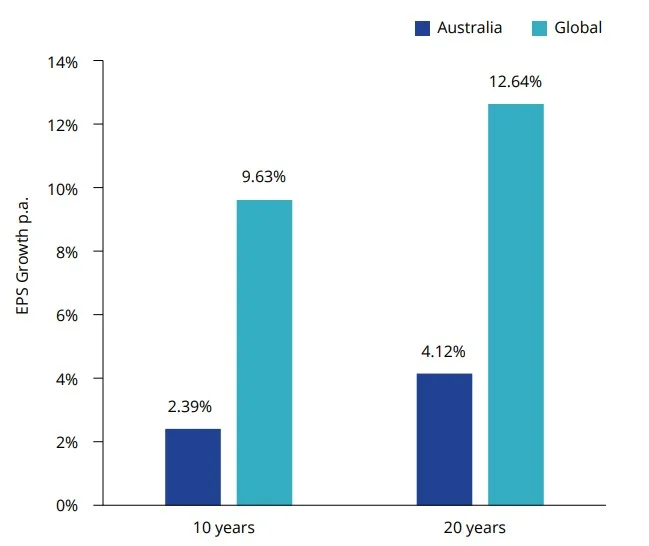
Higher average market capitalisation of global small-caps relative to Australian small-caps implies that these companies are more established businesses in the ‘growth’ phase of the business cycle. Australian small-caps by comparison have a higher proportion of companies in the ‘introduction’ phase, meaning that sales and earnings growth are likely to be more mixed, with a shorter track record.
| Chart 4: EPS growth comparison | Chart 5: Listing date comparison |
 |
 |
Charts 4 & 5 source: Bloomberg, as at 30 April 2023. Australia as S&P/ASX Small Ordinaries, Global as MSCI World ex Australia Small Cap. Past performance is not indicative of future performance.
Moreover, offshore exchanges have stricter rules around profitability and financial viability requirements for listing. Weaker listing requirements at home mean Australian small-caps have almost double the exposure to non-profitable companies, compared to global.
The largest Australian small-cap sector is materials. In the global index, it is one of the smallest sectors. Many small unprofitable mining companies list on the Australian stock exchange in the ‘infant’ stage of the business cycle to raise capital for exploration or mine development where debt and private equity financing is unavailable.
Chart 6: Percentage of unprofitable small cap companies by index weight
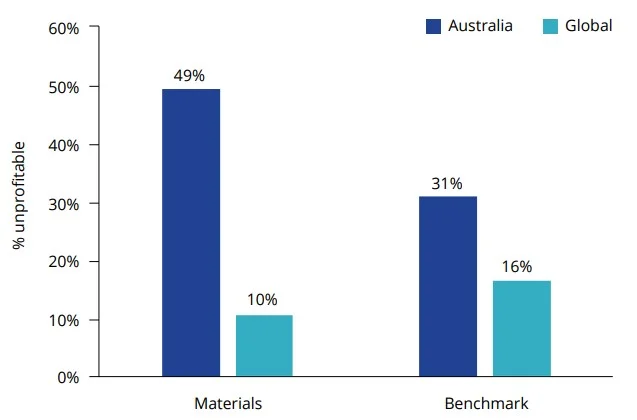
Source: Bloomberg, as at 30 April 2023. Australia is S&P/ASX Small Ordinaries, Global is MSCI World ex Australia Small Cap.
The price could be right for global small caps now
Now could be the time to buy global small caps with valuations, relative to large-caps, offering investors a buying opportunity not seen in decades.
Historically, small-cap stocks have led in market recoveries after selling-off during recessionary periods. According to Jill Carey Hall, head of US small- and mid-cap strategy at Bank of America, the firm’s economists are calling for a mild recession this year, beginning in the third quarter and lasting till early next year. The market usually bottoms before the economy—about six months before the recession is over—and “small-caps usually bottom around the same time as large-caps and then outperform off the bottom,” she says.
Investing in small caps is a long-term play and investors need to be patient. “There is certainly more potential for some downside risk near term,” says Hall. “But if you do have a longer time horizon and can potentially withstand some further potential downside or volatility, the longer-term multiyear backdrop for small-caps does look attractive.”
International investors are piling into the small-cap opportunity, according to the Wall Street Journal investors “have added a net $4.2 billion to US mutual and exchange-traded funds that buy small-capitalisation stocks this year, while pulling $17.4 billion from large-cap funds, according to data from Refinitiv Lipper,” (figures in US dollars).
We believe allocating to global small caps should be an integral part of investors’ satellite portfolio strategy. But investors need to be selective, the global small-cap universe is littered with haves and have-nots. One approach that has shown historical outperformance in the large and mid-cap universe while offering defensive characteristics is quality. This approach can also be used to identify small-cap companies which have a strong financial position and the ability to maintain earnings.
The defensive characteristics of quality small-caps can be seen when comparing the drawdown of MSCI World Small Cap Quality against MSCI World Small Cap following the global financial crisis. Quality returned to preGlobal financial crisis 5 months faster than the broader index.
Chart 7: Global Small Cap Equity Drawdown Comparison
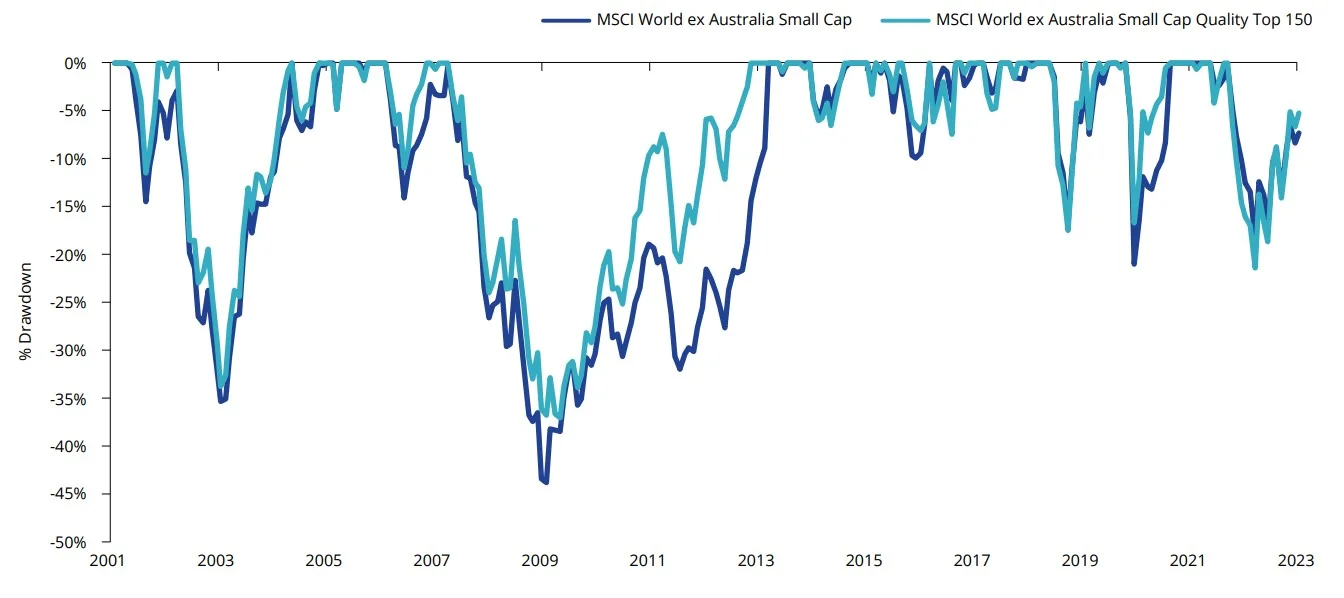
Source: MSCI, AUD returns. Past performance is not indicative of future performance. You cannot invest in an index.
This week we released a new research paper Global small-caps: An overlooked opportunity, in which shows global small-caps, which are typically underrepresented in Australian investment portfolios, have outperformed international large- and mid-caps as well as Australian small-caps over the long term.
The paper goes further, highlighting an approach to investing in global small companies. The paper shows that the outperformance of quality international small companies is actually higher than the outperformance of quality large international companies. The findings are supportive of Economist Robert Novy-Marx’s assertion that quality small companies are able to generate higher relative returns than quality larger companies.
The case is solved. VanEck’s QSML did it.

