
International investing has not only inspired Australian investors in allocating their wealth to household names such as Google, Apple and Johnson & Johnson but also diversified their portfolios to the economic and sector opportunities underrepresented in Australia. Here we provide some insightful analysis for our popular International Quality ETF (QUAL) versus the standard international equity benchmark, particularly in light of the macroeconomic environment.
Australian investors have been investing offshore for some time and the rise of ETFs has increased the opportunity set and further opened the investment landscape. Investing internationally makes sense. The size of the ASX is less than 2% of total assets invested on exchanges globally. No investor should be missing out on the 98% of opportunities. Some of these opportunities include companies like Google, Apple, Microsoft and Johnson & Johnson (J&J). These are all household names but for Australian investors looking to access their growth, these investment propositions have not been readily available on the ASX.
Historically, there have been two popular approaches to investing in international equities:
- via an actively managed fund; or
- via a passive fund tracking the benchmark index.
When actively managed funds were first offered to investors, costs and the dispersion of returns were high. Sometimes the returns were good, but often they were not. Many people found this a poor bargain and moved to lower cost passive funds that tracked traditional indices. In these new funds, returns could be thought of as average – not high, not low, just the market average.
When it comes to international investing in a passive fund, the widely used benchmark is the MSCI World ex Australia Index, for ease of reading let’s call it the International Equity Index. This index has over 1,500 companies in it, and not all of them are desirable from an investing point-of-view.
Now, there is a third approach to international investing.
It is this approach VanEck offers in international equities, and it is being used by savvy investors as a substitute for the two existing popular approaches. While being a new innovation, its foundations have been around as long as investors have been analysing companies.
At VanEck we have offered investors opportunities to diversify offshore since 1956. Our approach is synonymous with investing greats Benjamin Graham and his student Warren Buffett’s investment philosophies. Deeply embedded in Benjamin Graham’s value investing philosophy is the concept of ‘quality’. In what is considered one of the world’s best investing almanacs “The Intelligent Investor” Benjamin Graham outlines some of the fundamental measures he looks for in a company. There are seven in total but ones that investors should not ignore include a sufficiently strong financial condition, earnings stability and earnings growth.
These characteristics have become synonymous with ‘quality’ investing.
Our International Quality ETF (QUAL) tracks the MSCI World ex Australia Quality Index and it targets international companies with a high return on equity (ROE), low debt and stable earnings. Those fundamentals Graham suggested investors should not ignore and are, we would argue, key components for many active managers’ processes.
And in the current economic environment, with US economic indicators starting to weaken and a possible recession looming, quality companies may provide defensive characteristics that could appeal to investors in the months ahead.
You can read more about quality investing – here.
We think QUAL provides a compelling alternative to ETFs that track the International Equity Index.
So, let’s walk through the difference between the QUAL and the International Equity Index.
QUAL vs International Equity Index – performance
Since QUAL launched in 2014, its quality approach has served Australian investors well. Over longer-term periods QUAL has outperformed the International Equity Index – testament to quality investing’s prowess across the range of economic cycles.
Chart 1: Cumulative performance since QUAL inception date to 30 April
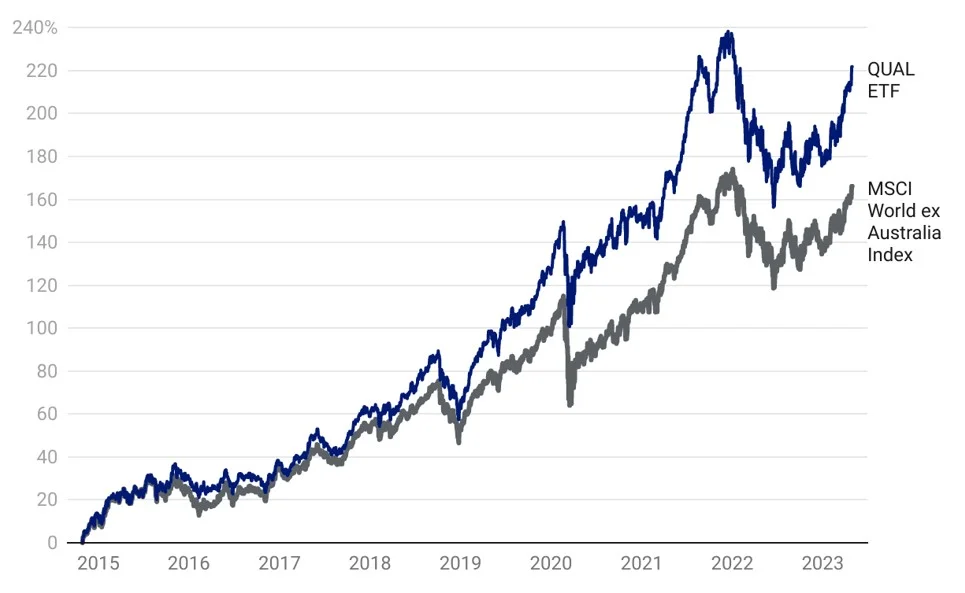
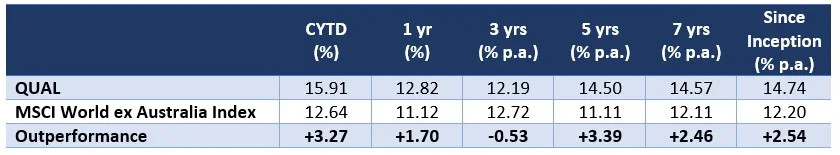
Table 1: Trailing performance to 30 April 2023
*Inception date is 29 October 2014 – the most recent factsheet is here.
Chart 1 and Table 1 source: Morningstar Direct, VanEck. The chart and table above show past performance of QUAL and of the MSCI World ex Australia Index. You cannot invest directly in an index. Results are calculated to the last business day of the month and assume immediate reinvestment of distributions. QUAL results are net of management fees and other costs incurred in the fund, but before brokerage fees and bid/ask spreads incurred when investors buy/sell on the ASX. Returns for periods longer than one year are annualised. Past performance is not a reliable indicator of future performance. The MSCI World ex Australia Index (“MSCI World ex Aus”) is shown for comparison purposes, as it is the widely recognised benchmark used to measure the performance of developed market large- and mid-cap companies, weighted by market capitalisation. QUAL’s index measures the performance of 300 companies selected from MSCI World ex Aus based on MSCI quality scores, weighted by market cap x quality score at rebalance. Consequently, QUAL’s index has fewer companies and different country and industry allocations than MSCI World ex Aus. Click here for more details.
QUAL in an economic contraction
There has been much speculation about the global economy. In developed markets central banks, including our own and the US’s Federal Reserve, have been raising rates in an effort to curb inflation. The impact of raising rates is to slow down the economy. There is a fear that the current rate rising cycle may lead to an economic contraction, particularly in the US.
In the chart below, we label each stage of the economic cycle with a colour: recovery (blue), expansion (green), slowdown (orange) and contraction (purple). The Purchasing Managers’ Index (PMI) is an index used to measure the prevailing direction of economic trends in the manufacturing and service sectors. It measures the change in production levels across the economy from month-to-month so is considered a key indicator of the state of the economy.
To illustrate how the quality factor may perform in the current economic environment, in Chart 2 below we overlay the PMI with the relative performance of ‘quality’ (MSCI World Quality Index/MSCI World Index), the black line. When the black line is rising, quality is outperforming. You can see below the PMI is contracting, and over the past few months quality has been outperforming.
Chart 2: US ISM Manufacturing PMI Index and relative MSCI World Quality performance
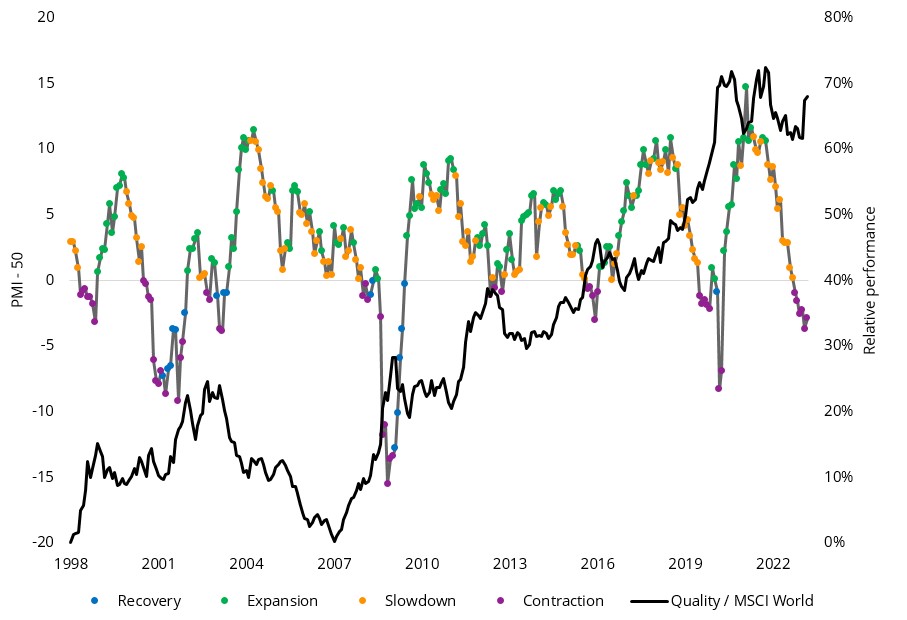
Source: Bloomberg, MSCI, April 2023. Past performance is not a reliable indicator of future performance. Quality and MSCI World represented by the MSCI World Quality Index and MSCI World Index respectively. You cannot invest directly in an index.
It is evident from the above that quality had periods of outperformance and underperformance and that these tend to correlate to the economic cycle. The table below represents the returns of the quality factor through the economic cycles since 1997.
Table 2: Quality Factor performance during different economic regimes
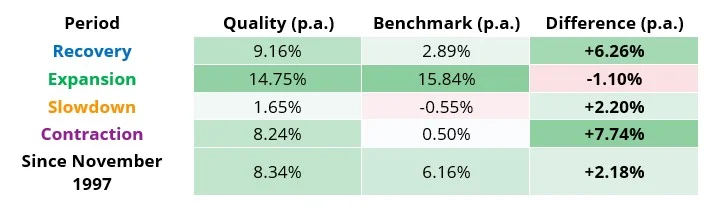
Source: Bloomberg, MSCI, Since common inception (November 1997) to March 2023. Past performance is not a reliable indicator of future performance. Quality and Benchmark represented by the MSCI World Quality Index and MSCI World Index respectively.
You can see that quality historically outperformed most during a contraction and subsequent recovery. As a result of these performance characteristics, the quality factor has earned the reputation as being a ‘defensive factor’. Quality companies have historically stable earnings and are lowly leveraged, so they are typically better equipped to withstand the extremes of the economic cycle.
The analysis shows that while quality does tend to behave defensively in downturns, it also tends to capture a fair share of the upside in expansions. While we always point out that past performance cannot be relied upon for future performance, the quality factor has historically demonstrated long-term outperformance across entire economic cycles.
We highlighted the importance of quality during slowdowns and contractions here and here.
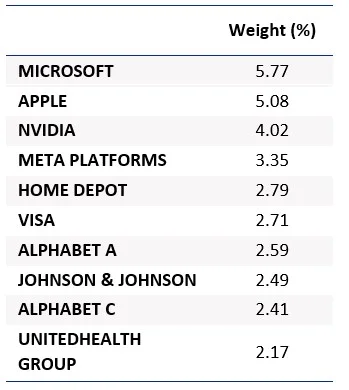
QUAL vs International Equity Index – top 10 holdings
Below you can see the top 10 companies. The top 10 holdings are companies that investors can relate to in their day-to-day lives – to see all the holdings in QUAL and their weightings click here.
| Table 3: Top 10 holdings QUAL | Table 4: Top 10 MSCI World ex Australia Index |
 |
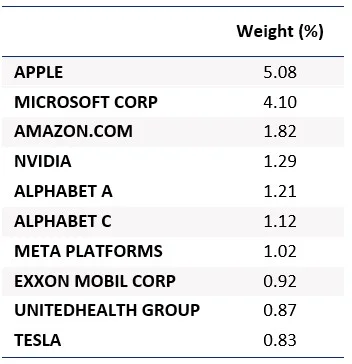 |
Source: FactSet, VanEck, MSCI, as at 30 April 2023
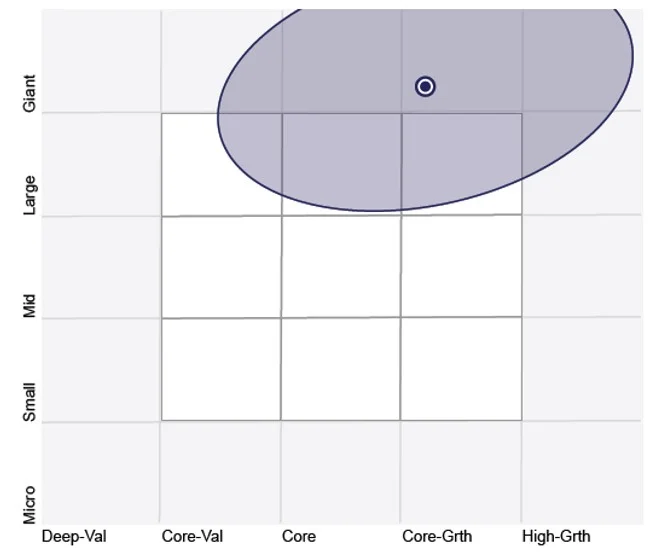
QUAL vs International Equity Index – Style
When looking at portfolios it is important to determine what style, e.g. value or growth, and what size bias a portfolio holds, e.g. giant, large, mid or small. Below we can see QUAL’s. Importantly QUAL holds giant companies with a core-growth orientation relative to the International Equity Index.
| Chart 3: QUAL holdings-based style map | Chart 4: MSCI World ex Australia Index holdings-based style map |
 |
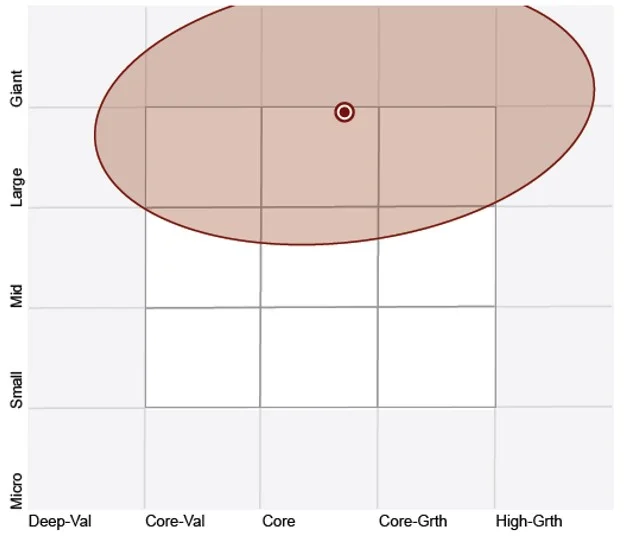 |
Source: Morningstar Direct, as at 30 April 2023
QUAL vs International Equity Index – Fundamentals
Table 5: Statistics and fundamentals
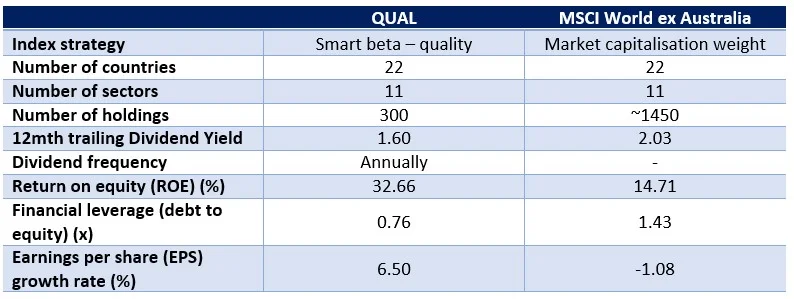
Source: VanEck, MSCI, FactSet, as at 30 April 2023. You cannot invest directly in an index.
As you would expect, QUAL has higher ROE, lower financial leverage and a higher EPS growth rate.
While many international equity ETFs have merits for portfolio inclusion, you should assess all the risks and consider your investment objectives.
Hedged versions of many exposures noted exist too.
Past performance is no guarantee of future performance. The above is not a recommendation. Please speak to your financial adviser or stock broker.

