
The swift collapse of Silicon Valley Bank (SIVB) and Signature Bank (SBNY) weighed on markets last week. Ultimately, the issues at SIVB and SBNY were poor risk management. Episodes like these serve as important cautionary tales, amplified in the current environment in which rapidly rising rates have made the economy fragile. As the Fed navigates inflation and, now, a stable banking system, its chance of a soft landing is getting slimmer, therefore positioning portfolios for a US recession may be prudent risk management.
As we now know, the very low level of interest rates prior to 2022 led to many companies, including US regional banks to binge on debt, this combined with the 2018 relaxation of the Dodd-Frank Act, has contributed to some balance sheets being in a poor shape as rates continue to rise. Systemic banking system problems are not new, and the more stringent capital requirements that were put in place following the GFC act as a buffer for depositors, but the risks for investors remain – it is worth noting that over 500 US banks have failed since 2008.
Recall 2016 when fears of a recession, low growth, negative rates and the fallout from Brexit significantly impacted the performance of all major European banks, amplified by calls for bailouts for problematic German and Italian banks. At the time Italian banks had approximately €360 billion or 17% of all bank loans considered “non-performing”, while Deutsche Bank has lost half of its value as it shelled out billions of dollars in fines.
Again, risk management.
Investing in quality international companies has been used by investors as a way to manage risk, especially during periods of heightened volatility and economic weakness as quality companies tend to lose less and recover faster.
VanEck MSCI International Quality ETF (QUAL) invests in 300 quality international companies that have strong balance sheets, high ROEs and stable earnings and therefore excludes many banks based on their excessive financial leverage. QHAL, the Australian dollar hedged version of QUAL, allows investors to manage their desired Australian dollar currency exposure.
US regional banks on shaky ground
The rising interest rate environment, in which the US Federal Reserve raised rates from a band of 0.25% to 0.5% to 4.5% to 4.75% within twelve months made it harder for SIVB to finance itself, while also eroding the value of its existing loans and assets.
When short-term rates rose higher than long-term rates, as has happened in the US over the past few months, SIVB’s long term investments were on shaky ground. With a concentrated client base of tech firms, when funding became harder in a high-interest rate environment, SIVB clients began to draw on their deposits. At the same time, the higher short-term rates resulted in falling prices for its long-term bonds.
SIVB was being forced to sell these longer-dated bonds at a loss to fund the deposits its customers were withdrawing. The announcement by SIVB looking to raise US$2.5 billion, triggered a run as depositors feared for their accounts. The bank collapsed, impacting the price of other regional banks.
Chart 1: The fall of US regional banks has been sharp
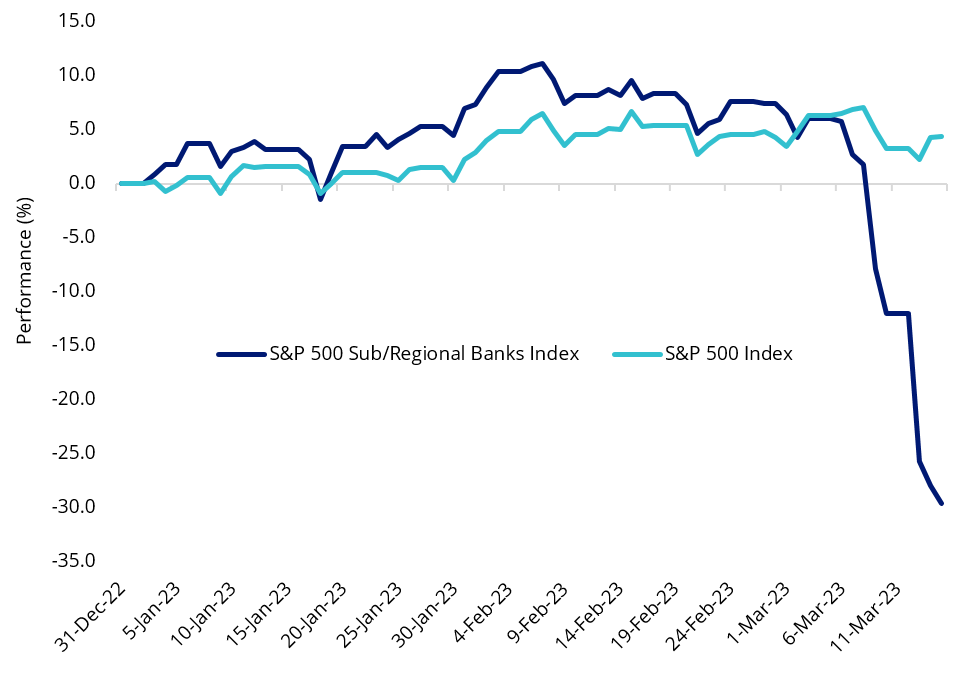
Source: Morningstar, to 15 March 2023. Returns in Australian dollars. Past performance is not a reliable indicator of future performance. You cannot invest in an index.
The Fed moved quickly, and while it does not look like SVB’s collapse will trigger a wider financial crisis, it does highlight to investors the risks of rapidly rising rates. It is also a cautionary tale about risk management. SIVB was not prepared for higher rates.
Quality companies have low financial leverage
Investing in quality international companies has been the “go-to” for many investors during periods of volatility, particularly during economic downturns. As mentioned above, short term rates in the US are higher than long term rates. In the past this has been a predictor of a recession.
The following chart shows the relative outperformance of the index QUAL tracks, the MSCI World ex Australian Quality Index (QUAL Index) relative to the broader MSCI World ex Australia Index during calendar years of banking or debt market crises since QUAL Index’s inception. We’ve included the recent downturn, capturing performance month to date (to the 15thMarch 2023).
Chart 2: Relative Performance of QUAL Index during periods of crises
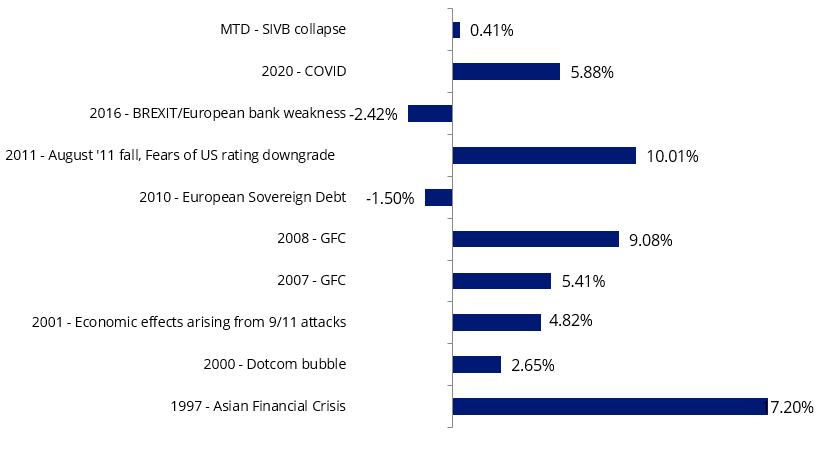
Source: MSCI, VanEck, Bloomberg. MTD is 1 March 2023 to 15 March 2023. Inception date of MSCI World ex Australia Quality Index is 30 November 1994. Results include the reinvestment of all dividends but do not include management costs or brokerage expenses associated with an investment in the fund. You cannot invest in an index. Results reflect past performance and do not guarantee future results of the index or the fund.
If the US economy falters and we enter a recession, quality companies may outperform, as they tend to offer investors relative protection during weaker economic environments and heightened market volatility. The MSCI World ex Australia Quality Index (‘QUAL Index’) seeks to identify companies with high ROE, stable earnings and low financial leverage. These types of companies are historically less correlated with the broad business cycle. The QUAL Index avoids companies with high financial leverage and therefore excludes banks.
To illustrate how the quality factor may perform in the current economic environment, in Chart 3 below we overlay the manufacturing activity (a proxy for economic activity) with the relative performance of quality (MSCI World Quality Index/MSCI World Index). In the chart below each economic regime is represented by a colour: recovery (blue), expansion (green), slowdown (orange) and contraction (purple).
Chart 3 – US ISM Manufacturing PMI Index and relative MSCI World Quality performance
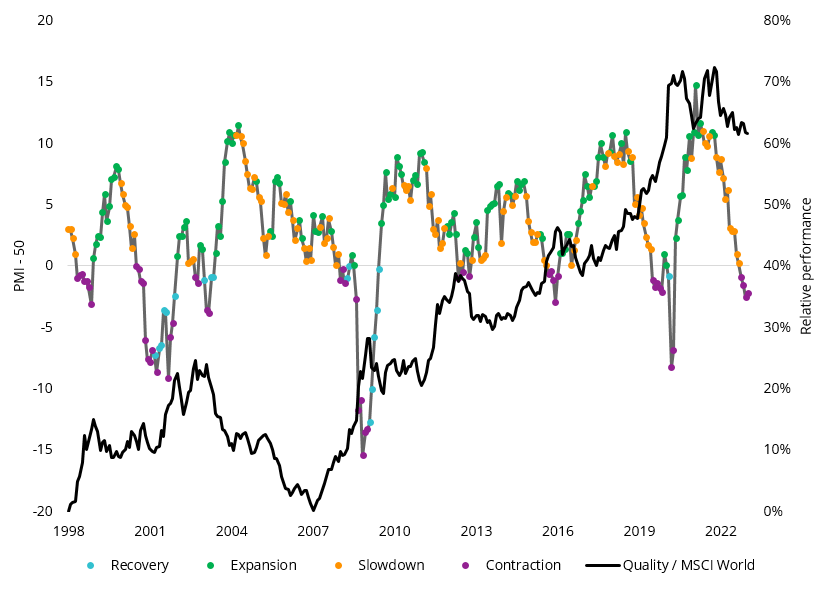
Source: Bloomberg, MSCI, February 2023. Past performance is not a reliable indicator of future performance
The dark grey line illustrates Quality has outperformed over the long term, but also it is evident that quality had periods of outperformance and underperformance and that these tend to correlate to the economic cycle. The table below represents the returns of the quality factor through the cycle.
Table 1: Quality Factor performance during different economic regimes
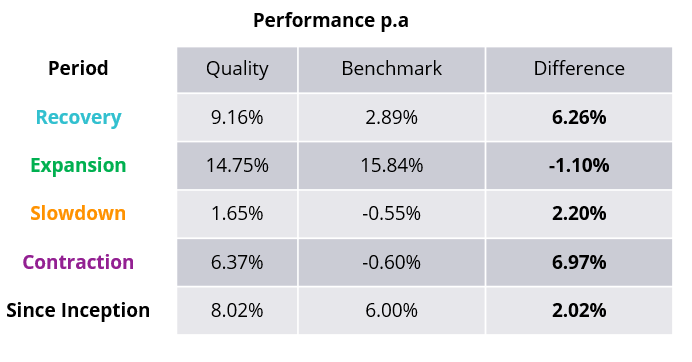
Source: Bloomberg, MSCI, February 2023. Past performance is not a reliable indicator of future performance.
You can see that quality historically outperformed most during a contraction and subsequent recovery. As a result of these performance characteristics, the quality factor has earned the reputation as being a ‘defensive factor’. Quality companies have dependable earnings and are lowly leveraged, so they are able to better withstand the extremes of the economic cycle.
It is challenging for investors to navigate economic conditions and prevailing markets. ETFs that capture the factors outlined are being used by savvy investors as tools, to either hold through the cycle, or blend, to help mitigate the troughs of the cycle.
Key risks
An investment in QUAL and QHAL carries risks associated with ASX trading time differences, financial markets generally, individual company management, industry sectors, foreign currency, currency hedging, country or sector concentration, political, regulatory and tax risks, fund operations and tracking an index. See the PDS for details.

