
By Jamie Hannah – Deputy Head of Investments & Capital Markets
BHP consolidated 12 months ago making it the largest company on ASX and making the Australian benchmark index, the S&P/ASX 200, more concentrated than almost every other benchmark index in the world. 12 months on and funds that track the largest 200 or 300 Australian companies may not be delivering the diversification objective investors target.
When allocating to a portfolio of 200 or 300 companies an investor would naturally expect more diversification than having 50% of their investment to go to just two sectors, or have 45% invested in just 10 companies. However, that is the reality of what you’re getting when you invest in a fund that tracks Australia’s benchmark indices. Diversification is an important risk management tool. That is why it is prudent to take the right approach when investing in Australian equities. Here we provide some insightful analysis for our popular Australian Equal Weight ETF (MVW) versus the S&P/ASX 200.
During the past week the VanEck Australian Equal Weight ETF celebrated its ninth birthday. When it launched, equal weighting was a new concept in Australia. MVW has now demonstrated the proof of concept. Consistent with the US and Europe where equal weight portfolios have outperformed traditional market cap strategies over the long term, MVW has outperformed the S&P/ASX 200 since its inception.
Equal weighting, at its core, aims to increase diversification, so that one stock and sector do not dominate a portfolio. In Australia, MVW reduces the concentration risk to the top 10 companies which dominate Australian equity portfolios. Consequently, MVW also provides better exposure to the broad economy.
12 months ago, BHP consolidated its Australian and UK listings into a single entity on ASX. At the time BHP made up over 11% of the S&P/ASX 200 increasing from just under 7% at the start of January 2022.
12 months on, not much has changed. When you consider the sector composition of the S&P/ASX’s top 10, five companies are banks and two are materials. Investors buying a diversified Australian equity strategy would think it is unlikely one stock would be 10% of the portfolio, nor would they think two sectors represent over 50% of the portfolio, but that is what you will be getting from a portfolio linked to Australia’s largest 200 or 300 companies.
Concentration makes sense if you have high conviction in these stocks and sectors. Investors seeking diversification however may be disappointed by the concentration they get if they are in a fund tracking the S&P/ASX 200.
Given that we have just gone through an earnings season, in which many Australian companies reported their earnings, let’s walk through the performance difference between MVW and the S&P/ASX 200.
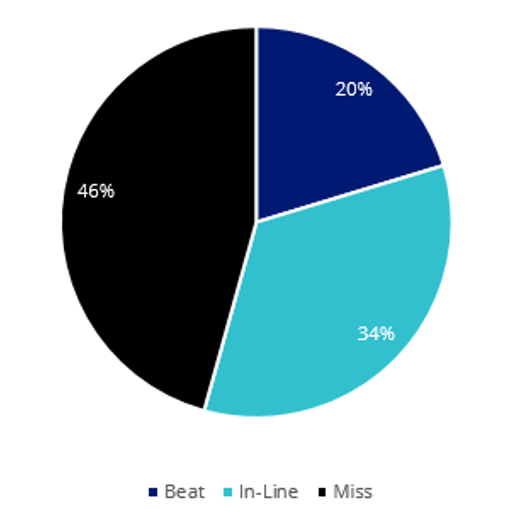
Before we get started, in summary February’s 2023 ASX earnings per share (EPS) results showed more misses than beats, highlighting that picking winners is difficult. In some instances, the devil was in the detail, for example, CBA was in-line with expectations, but its share price fell 6% after the announcement because despite rising rates, the bank’s net interest margin (NIM) appears to have peaked. Competition has led to the bank writing home loans at below their cost of capital and there are also fears that impairments could rise.
Chart 1: S&P/ASX 200 Earnings per share actuals (2.5% range)
Source: Bloomberg
MVW vs S&P/ASX 200 Index – Sectors
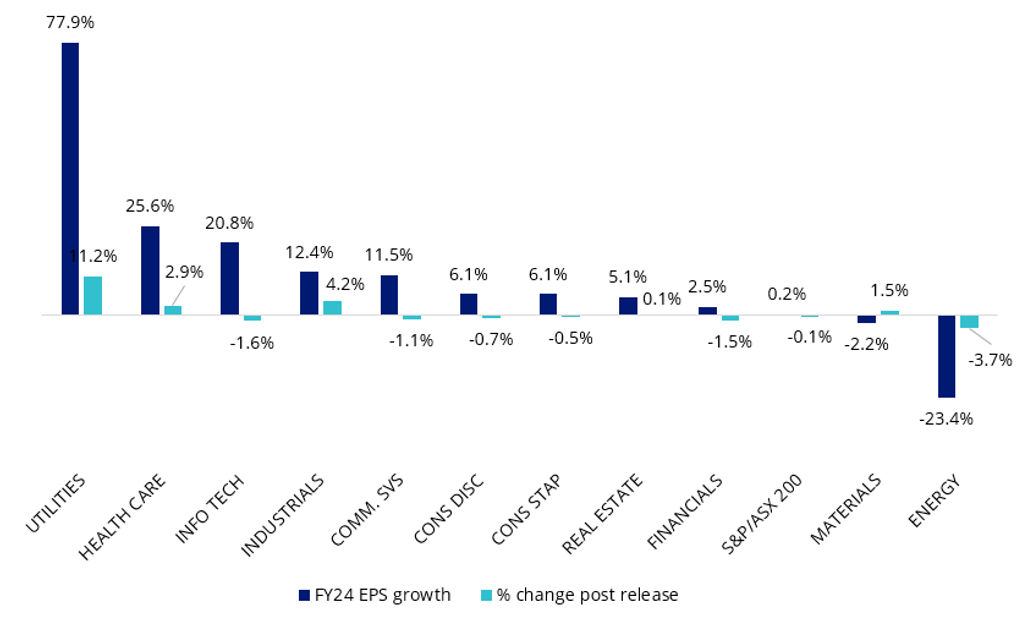
MVW is currently underweight the financials’ sector by 9.45% compared to the S&P/ASX 200 (Chart 3). Conversely it is overweight industrials, utilities and consumer staples. If we consider the full year 2024 (FY24) EPS forward consensus growth and the percentage change in FY24 EPS growth following the February ASX reporting season, those sectors that analysts think have the most growth potential are industrials and utilities. It is these sectors MVW is overweight.
Chart 2: S&P/ASX 200 EPS growth revisions pre and post earnings release
Source: Refinitiv
Chart 3: Sector weight differential: MVW vs S&P/ASX 200
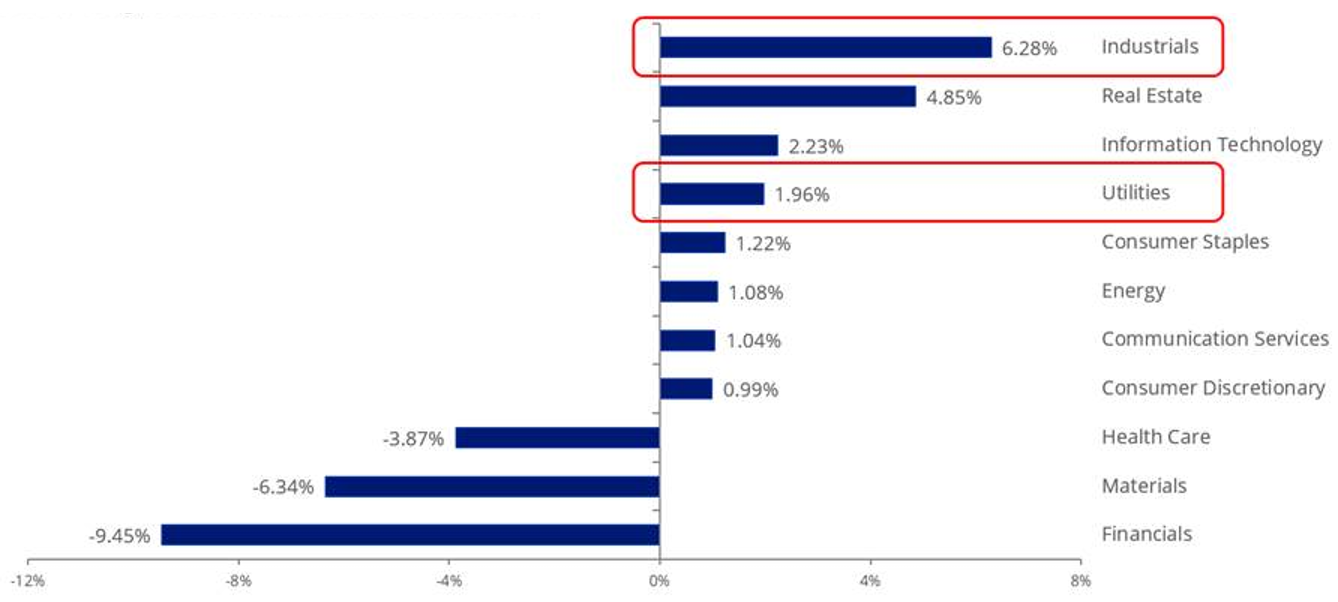
Source: FactSet, as at 28 February 2023. Calculated by subtracting S&P/ASX 200 Index from respective MVW sector weights; positive differentials indicate greater MVW weight in the sector.
MVW vs S&P/ASX 200 – Performance
As mentioned above, equal weight investing outperformed since its inception on ASX in 2014. As at the end of February 2023, MVW has outperformed the S&P/ASX 200 by 1.63% p.a. And as always, past performance is not indicative of future results.
Chart 4: Cumulative performance since MVW inception date to 28 February 2023
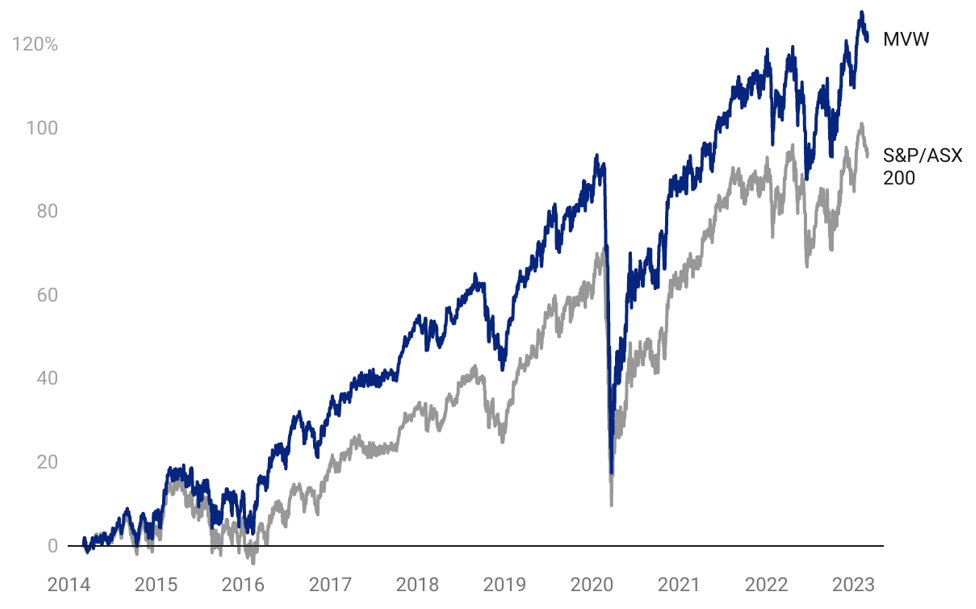
Table 1: Trailing performance to 28 February 2023
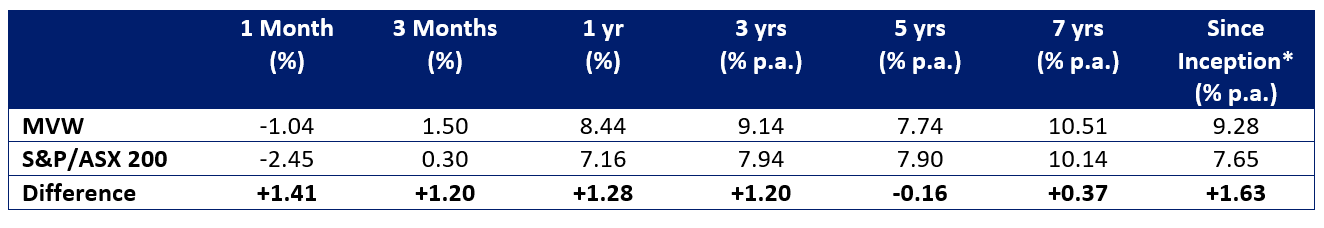
* MVW Inception date is 4 March 2014 a copy of the factsheet is here. Chart 4 and Table 1 source: Morningstar Direct, VanEck as at 28 February 2023. The chart and table above show past performance of MVW and of the S&P/ASX 200. You cannot invest directly in an index. Results are calculated to the last business day of the month and assume immediate reinvestment of distributions. MVW results are net of management fees and other costs incurred in the fund, but before brokerage fees and bid/ask spreads incurred when investors buy/sell on the ASX. Returns for periods longer than one year are annualised. Past performance is not a reliable indicator of future performance. The S&P/ASX 200 Index is shown for comparison purposes as it is the widely recognised benchmark used to measure the performance of the broad Australian equities market. It includes the 200 largest ASX-listed companies, weighted by market capitalisation. MVW’s index measures the performance of the largest and most liquid ASX-listed companies, weighted equally at rebalance. MVW’s index has fewer companies and different industry allocations than the S&P/ASX 200. Click here for more details.
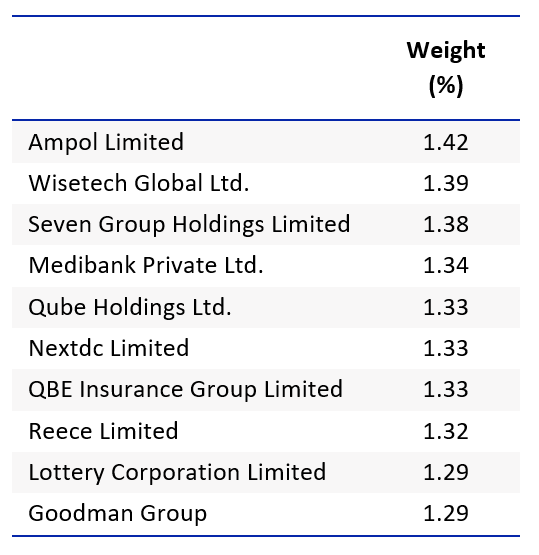
MVW vs S&P/ASX 200 Index – Top 10 holdings
Below you can see the top 10 companies. The differences are stark – to see all the holdings in MVW and their weightings click here.
| Table 2: Top 10 holdings MVW | Table 3: Top 10 S&P/ASX 200 |
 |
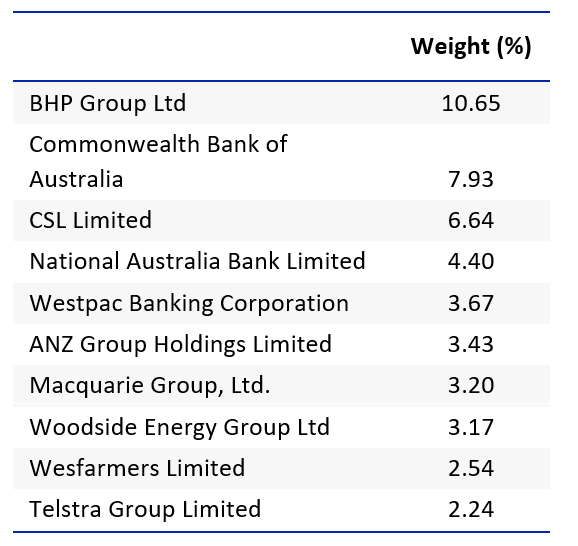 |
| Source: Factset, VanEck, MVIS, as at 28 February 2023 | Source: Factset, VanEck, S&P, as at 28 February 2023 |
The reason MVW’s holdings are not equal above is that it only rebalances back to equal weight each quarter. The next rebalance is next week (Friday 17thMarch).
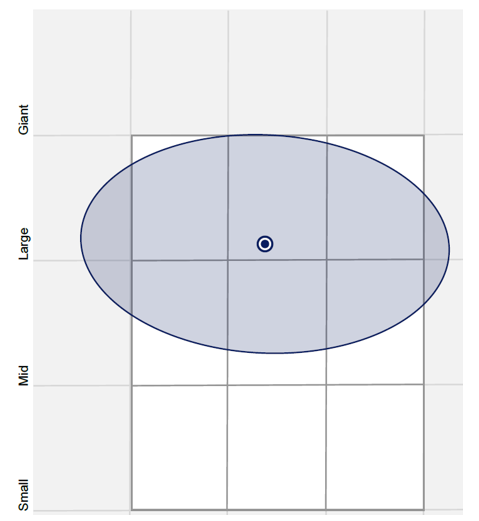
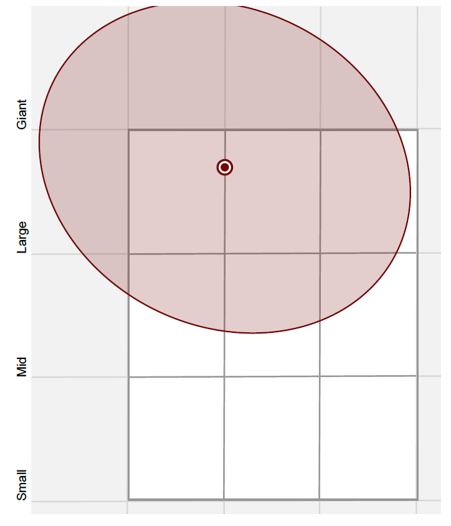
MVW vs S&P/ASX 200 Index – Style
When looking at portfolios it is important to determine what style e.g. value or growth and what size bias a portfolio holds e.g. giant, large, mid or small. Below we can see MVW’s. Importantly MVW holds large companies with a similar value-core orientation relative to the S&P/ASX 200, which skews larger (giant) and more toward growth.
| Chart 3: MVW holdings based style map | Chart 4: S&P/ASX 200 holdings based style map |
 |
 |
| Source: Morningstar Direct, as at 28 February 2023. | Source: Morningstar Direct, as at 28 February 2023. |
While each Australian equity ETF has its merit for portfolio inclusion, you should assess all the risks and consider your investment objectives.
Key risks
An investment MVW carries risks associated with: ASX trading time differences, financial markets generally, individual company management, industry sectors, country or sector concentration, political, regulatory and tax risks, fund operations and tracking an index. See the PDS for details.
Past performance is no guarantee of future performance. The above is not a recommendation. Please speak to your financial adviser or stock broker.

