
It was reported in the Australian Financial Review under the headline, Macquarie downgrades banks to ‘underweight’, that Macquarie analysts “see downside risk to earnings beyond the first half of 2023. Higher and persistent inflation and higher rates will likely result in lower asset prices, higher costs, and the risk of impairments.”
There is no doubt that Australian banks face a period of uncertainty in the face of an economic slowdown, higher rates and a declining property market. But despite rate rises over the past year, an analysis of RBA data shows that, Australian Banks’ Net Interest Margins (NIMS) have been contracting. This does not bode well for bank shares.
While we are not saying sell or short banks, we are saying that it is a risk to have your portfolio overexposed to them. This is one of the advantages of active management, your active manager may already be underweight banks, or maybe not.
There is a passive approach that is underweight banks giving you active-like outcomes, without the active-like fees.
The way many active managers construct their portfolios is to hold positions similar to the index they are aiming to beat, otherwise they are taking on a big risk. They will be overweight companies they like and be underweight companies they don’t like, but within a prescribed range, because if markets go against them and they drastically underperform the index, they will be seen as incompetent. Better to be just above or just below the index.
For this, active managers charge higher fees. These higher fees are to pay for the costs of the analysts and their tools that pick the overweight and underweight positions.
The rise of passive management, including ETFs, has been attributed to a combination of the lower fees of passive management and the uncertainty of active management performance.
Most Australian equity portfolios, passive and active, are linked to the S&P/ASX 200 Index so are likely to have a significant exposure to banks. A purely passive exposure sits at around 20%. The reason banks dominate Australian portfolios is because of their size.
The S&P/ASX 200 is a market capitalisation index. A market capitalisation index uses the size of a company for inclusion and its representation in that index relates to its size. Therefore, in a market capitalisation index, the larger companies have bigger weights. This means Australian portfolios linked to this index currently have significant exposure to big banks.
A sizeable allocation makes sense if you are confident the sector will do well, but if you are not, it may not be prudent risk management.
For Australian equities there is a passive approach that combines the best of active and passive management: Equal weighting.
The equal weight index that the VanEck Australian Equal Weight ETF (MVW) tracks is a smart beta index that equally weights the largest and most liquid stocks on the ASX at each rebalance. Because of this, at last rebalance, no company was more than 1.19%. MVW’s exposure to the big four banks at that time was only 4.76% (as at 31 January 2023 it was 4.73%).
In the past, taking an equally weighted approach has been proven to produce outperformance over the long-term compared to a benchmark market capitalisation approach as well as providing diversification benefits.
So, let’s walk through the difference between MVW and the S&P/ASX 200.
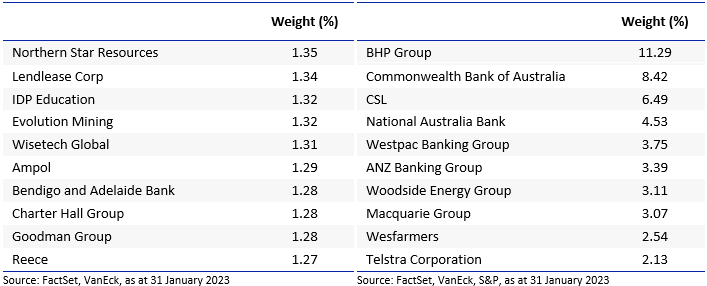
MVW vs S&P/ASX 200 Index – Top 10 holdings
Below you can see the top 10 companies. The differences are stark. Nearly one half of the 200-company portfolio is in just 10 companies in the S&P/ASX 200. That means the other 190 companies squeeze into the remaining 50%. MVW’s top ten, total just 13.04%, the remaining 86.96% includes 74 companies all roughly equally weighted. The reason MVW’s holdings are not equal below is that it only rebalances back to equal weight each quarter. To see all the holdings in MVW and their weightings click here.
Table 1: Top 10 holdings MVW Table 2: Top 10 S&P/ASX 200
MVW vs S&P/ASX 200 Index – Sectors
MVW is currently underweight the financials’ sector by 9.45% compared to the S&P/ASX 200. It is underweight materials by 6.34%. Conversely, it is overweight industrials by 6.28% and information technology by 2.23%.
Chart 1: S&P/ASX 200 and MVW Index sector weightings
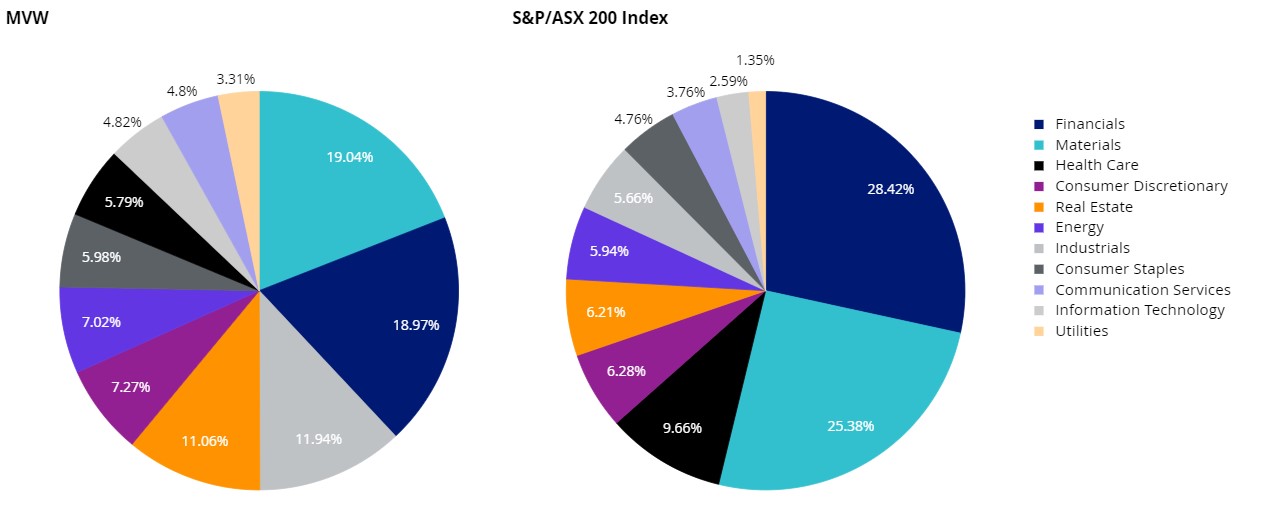
Source: FactSet, 31 January 2023
What this means is that if there is another systematic banking issue, or commodities fall the impact on the S&P/ASX 200 is greater than in the MVW Index.
MVW vs S&P/ASX 200 – Diversification
A way to measure diversification of a portfolio is to calculate its Herfindahl Index. This index is a broadly used technique to quantify concentration. When used inversely, this index measures diversification. As at the last rebalance in December 2022, the Herfindahl Index for the S&P/ASX 200 was 338. The equivalent measure for the index MVW tracks was 114. The MVW Index is therefore around a third as concentrated as the S&P/ASX 200. In other words, the MVW Index is roughly three times more diversified than the S&P/ASX 200.
MVW vs S&P/ASX 200 Index – Style
When looking at portfolios it is important to determine what style e.g. value or growth and what size bias a portfolio holds e.g. giant, large, mid or small. Below we can see MVW’s. Importantly MVW holds large companies with a similar Morningstar style of core orientation relative to the S&P/ASX 200, which skews larger (giant) and more toward value.
Chart 2: MVW holdings based style map Chart 3: S&P/ASX 200 holdings based style map
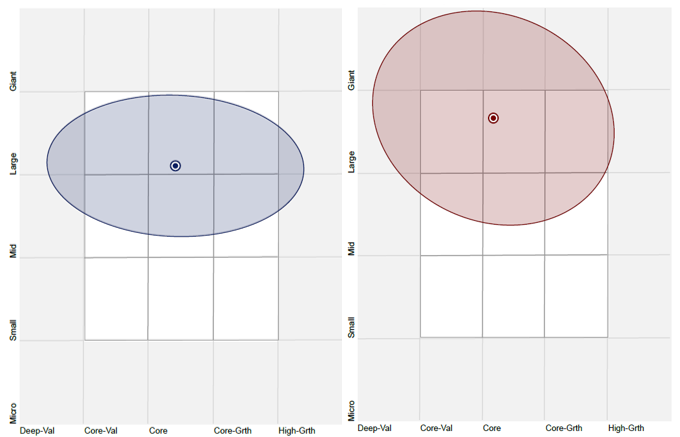
Source: Morningstar Direct, as at 31 January 2023 Source: Morningstar Direct, as at 31 January 2023
MVW vs S&P/ASX 200 – Performance
Equal weight investing has served Australian investors. At the end of January 2023, since its inception on ASX in 2014, MVW has outperformed the S&P/ASX 200 by 1.47% p.a. As always, past performance is by no means indicative of future performance.
Chart 4: Cumulative performance since MVW inception date to 31 August 2022
Table 3: Trailing performance to 31 January 2023
| 1 mth (%) | 3 mths (%) | 6 mths (%) | 1 yr
(%) |
3 yrs
(% p.a.) |
5 yrs
(%p.a.) |
7 yrs (% p.a.) |
Since inception (% p.a.) | |
| VanEck Australian Equal Weight ETF (MVW) | 5.73 | 9.23 | 10.37 | 12.11 | 5.80 | 8.00 | 11.15 | 9.49 |
| S&P/ASX 200 Accumulation Index | 6.23 | 9.59 | 10.32 | 12.21 | 5.96 | 8.51 | 10.25 | 8.02 |
| Difference | -0.50 | -0.36 | 0.05 | -0.10 | -0.16 | -0.51 | +0.90 | +1.47 |
* MVW Inception date is 4 March 2014 a copy of the factsheet is here.
Chart 4 and Table 3 source: Morningstar Direct, VanEck as at 31 January 2023. The chart and table above show past performance of MVW and of the S&P/ASX 200. You cannot invest directly in an index. Results are calculated to the last business day of the month and assume immediate reinvestment of distributions. MVW results are net of management fees and other costs incurred in the fund, but before brokerage fees and bid/ask spreads incurred when investors buy/sell on the ASX. Returns for periods longer than one year are annualised. Past performance is not a reliable indicator of future performance. The S&P/ASX 200 Index is shown for comparison purposes as it is the widely recognised benchmark used to measure the performance of the broad Australian equities market. It includes the 200 largest ASX-listed companies, weighted by market capitalisation. MVW’s index measures the performance of the largest and most liquid ASX-listed companies, weighted equally at rebalance. MVW’s index has fewer companies and different industry allocations than the S&P/ASX 200. Click here for more details.
MVW is being used by savvy investors as their core Australian equity portfolio, around which they add investment ideas. For example, should the economic environment become more favourable for banks, you can add to MVW by buying your preferred bank directly, as a satellite position. Alternatively, you could consider the VanEck Australian Banks ETF.
While each Australian equity approach, equal weight and market capitalisation, has its merit for portfolio inclusion, you should assess all the risks and consider your investment objectives.
Past performance is no guarantee of future performance. The above is not a recommendation. Please speak to your financial adviser or stock broker.
For further information you can email us or call on us on +61 2 8038 3300.
Key risks
An investment MVW carries risks associated with: ASX trading time differences, financial markets generally, individual company management, industry sectors, country or sector concentration, political, regulatory and tax risks, fund operations and tracking an index. See the PDS for details.

