
“In business, I look for economic castles protected by unbreachable moats.”
Warren Buffett
Moat investing is an investment philosophy popularised by Warren Buffett. To Buffett, the castle is the business and the moat is its competitive advantage: The wider the moat, the more sustainable the business.
By applying a consistent, forward-looking process to identifying companies with sustainable competitive advantages, Morningstar turns the moat investing philosophy into an actionable investment strategy.
In the current market environment moat investing is coming to the fore. Companies with sustainable businesses typically have strong cash flows and are better placed to manage slowdowns in the macroeconomic environment.
VanEck offers three ETFs that track indices that consider “moats”.
- MOAT is a high conviction portfolio of attractively priced US “Wide Moat” stocks, that tracks the Morningstar® Wide Moat Focus Index™ that, in addition to screening for companies that prove to have a sustainable competitive advantage, also have a favourable valuation in Morningstar’s estimation.
- GOAT is an international equities portfolio of the same strategy underpinning MOAT.
- DVDY is a high conviction Australian equities portfolio focusing on high dividend, quality companies based on Morningstar’s Economic Moat™ assessment and strong financial health based on Morningstar’s Distance to Default measure.
So far this year MOAT, GOAT and DVDY have outperformed the relevant broad market index in the markets they invest in. As always past performance is by no means an indication of future performance and you should consider this whenever fund performance is quoted.
The importance of value and quality in the current market
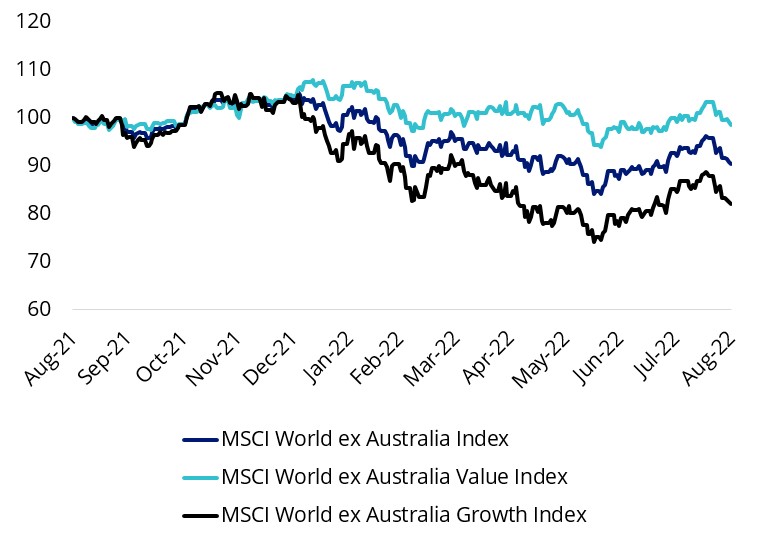
Value investing has been thrust back in the spotlight over the past 12 months. Value-oriented global equity stocks, as represented by MSCI World ex Australia Value Index, have outperformed growth stocks into 2022. The rebound in value stocks comes after a remarkably long stretch of being in the doldrums, outshone by growth stocks.
Figure 1: Value stocks have held up better so far in 2022
Now in the face of rising rates, the threat of a hard landing and subsequent economic weakness, many investors are assessing their long-term approach.
Inflation has returned with a vengeance and central banks around the world have been reinforcing their commitment to continue to raise rates to fight the spectre of uncontrollable growth. There is a fear of a ‘hard landing’. A hard landing refers to a period where the economy enters a recession following a series of central bank cash rate increases and it is the most common scenario following a Fed rate rising cycle (75 per cent of US monetary policy tightening cycles since 1955 have resulted in a recession).
As rates have been rising share markets have been falling. And markets are on edge.
If the global economic recovery falters and we enter a recession, it could benefit quality companies, as they tend to offer investors relative protection during weaker economic environments and heightened market volatility.
Figure 2 illustrates how quality companies typically outperform when manufacturing activity (a proxy for economic activity) decelerates (orange) and/or contracts (red).
Figure 2 – US ISM Manufacturing PMI Index and MSCI World Quality versus MSCI World performance
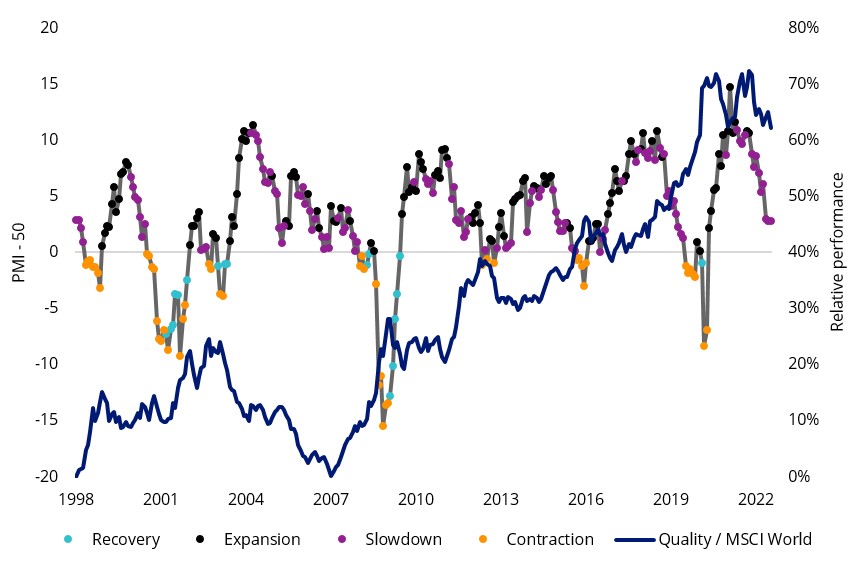
Table 1: Factor performance during different economic regimes
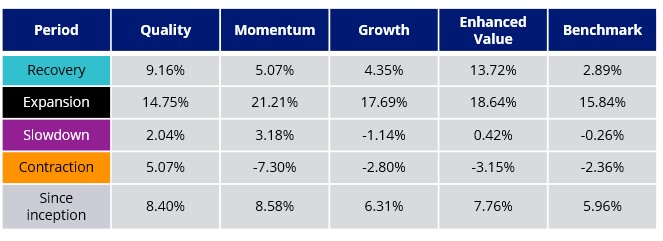
Figure 2 and table 1 source: Bloomberg. MSCI. Past performance is not a reliable indicator of future performance. You cannot invest directly in an index. Since Inception date is common inception of indices used, 31 December 1998 to 31 August 2022. Quality is MSCI World Quality Index, Momentum is MSCI World Momentum Index, Growth is MSCI World Growth Index, Enhanced Value is MSCI World Enhanced Value Index, Benchmark is MSCI World Index.
It is little wonder then why savvy investors are looking for opportunities, understanding they may not pick the bottom, but they were not going to pick the top either. Investors are fortifying their portfolios with quality companies, wary not to overpay in the current market.
Morningstar’s moat philosophy: Combining quality and value
Quality: The concept of an “economic moat” originated with a Warren Buffett interview. He said that he likes to buy companies that have moats around their businesses. Just like a medieval castle that had trenches filled with water to keep enemies at bay, a company can have a sustainable competitive advantage that protects its profits from competition. Morningstar have identified five different sources of economic moats: intangible assets, switching costs, network effect, cost advantage, and efficient scale. They have taken the metaphor coined by Buffett and turned it into a robust equity research methodology. Every company that Morningstar’s equity analysts assess gets one of three economic moat ratings: wide, narrow, or none.
Companies assigned a ‘wide’ moat rating are those in which Morningstar has very high confidence that excess returns will remain for 10 years, with excess returns more likely than not to remain for at least 20 years. Companies with a ‘narrow’ moat rating are those Morningstar believes are more likely than not to achieve normalised excess returns for at least the next 10 years. A firm with either no sustainable competitive advantage or one that Morningstar thinks will quickly dissipate is assigned a moat rating of ‘none’.
Value: The other pillar of Morningstar’s research methodology is valuation. It’s all well and good to buy a quality company with a strong competitive position, but if you’re overpaying for it, it’s not going to be a good investment. So, Morningstar calculates its own fair value estimates, which are Morningstar analysts’ estimates of what a company is worth. Over the long term, Morningstar expects a company’s share price and its fair value estimate to converge. But over the short term, there can be dislocations between these prices.
MOAT and GOAT
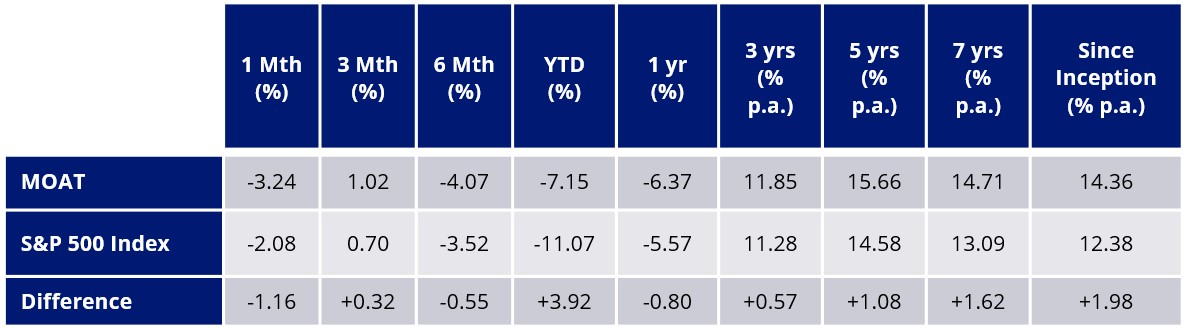
Our US equity ETF (MOAT) tracks the Morningstar® Wide Moat Focus Index™ that is a rules-based, equal-weighted index intending to offer exposure to attractively priced companies with sustainable competitive advantages according to Morningstar’s equity research team. And since its launch it has consistently outperformed the S&P 500.
MOAT performance is a testament to its value and quality approach.
Table 2: MOAT vs S&P 500 Index – Trailing performance to 31 August 2022
MOAT ASX Inception date is 26 June 2015 and a copy of the factsheet is here.
Source: Morningstar Direct, VanEck. All returns in Australian dollars. The chart and table above show past performance of MOAT and of the S&P500 Index. You cannot invest directly in an index. Results are calculated to the last business day of the month and assume immediate reinvestment of distributions. MOAT results are net of management fees and other costs incurred in the fund, but before brokerage fees and bid/ask spreads incurred when investors buy/sell on the ASX. Returns for periods longer than one year are annualised. Past performance is not a reliable indicator of future performance. The S&P 500 is shown for comparison purposes as it is the widely recognised benchmark used to measure the performance of the broad US equities market. It includes the 500 largest US listed companies, weighted by market capitalisation. MOAT’s index measures the performance of 40 to 80 US companies with a Morningstar Economic Moat Rating™ of “Wide”. MOAT’s index has fewer securities and different industry allocations than the S&P 500. Click here for more details.
GOAT is an international version of MOAT that boasts the same impressive results so far in 2022.
Table 2: GOAT vs MSCI World ex Australia Index – Trailing performance to 31 August 2022
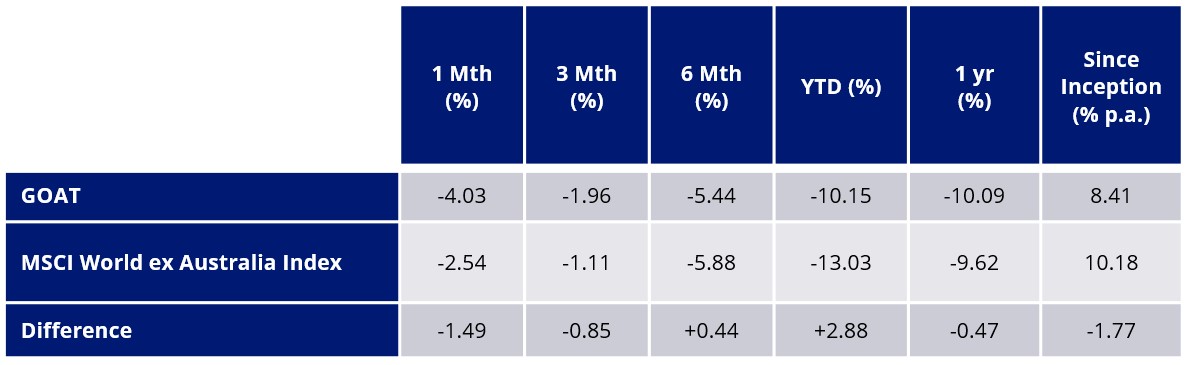
GOAT Inception date is 8 September 2020 and a copy of the factsheet is here.
Source: Morningstar Direct, VanEck. All returns in Australian dollars. The chart and table above show past performance of GOAT and of the MSCI World ex Australia Index. You cannot invest directly in an index. Results are calculated to the last business day of the month and assume immediate reinvestment of distributions. GOAT results are net of management fees and other costs incurred in the fund, but before brokerage fees and bid/ask spreads incurred when investors buy/sell on the ASX. Returns for periods longer than one year are annualised. Past performance is not a reliable indicator of future performance. The MSCI World ex Australia Index (“MSCI World ex Aus”) is shown for comparison purposes as it is the widely recognised benchmark used to measure the performance of developed market large- and mid-cap companies, weighted by market capitalisation. GOAT’s index measures the performance of 50 to 100 developed market companies with a Morningstar Economic Moat Rating™ of “Wide” at rebalance. GOAT’s index has fewer companies and different country and industry allocations than MSCI World ex Aus. Click here for more details
The pursuit of income beyond value and quality
The yield factor is also recognised for its positive correlation to value and quality factor in equities. DVDY invests in Australian companies which Morningstar has selected based on a combination of their Economic Moat rating and Morningstar’s proprietary Distance to Default measure.
According to our website, for the 12 months to 31 August, DVDY’s 12-month Distribution yield was 5.34%, compared to the indicated dividend yield of the S&P/ASX 200 which was 4.55% (Source: S&P Dow Jones Indices). As noted above, this is by no means an indication of future performance.
DVDY has had a strong 2022 so far and is among the best performing equity income ETFs on ASX over that time.
Table 4: Trailing performance of DVDY to 31 August 2022
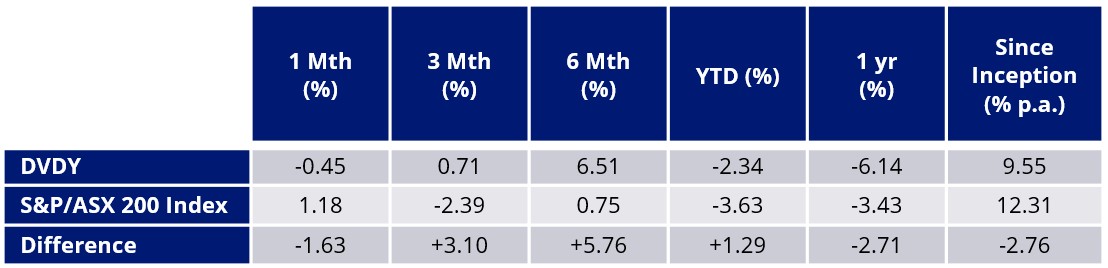
DVDY inception date is 7 September 2020 and a copy of the factsheet is here.
Source: VanEck, Morningstar, Bloomberg. You cannot invest directly in an index. Results are calculated to the last business day of the month and assume immediate reinvestment of distributions. DVDY results are net of management fees and other costs incurred in the fund, but before brokerage fees and bid/ask spreads incurred when investors buy/sell on the ASX. Returns for periods longer than one year are annualised. Past performance is not a reliable indicator of future performance.
Effective 7 July 2022 DVDY’s index changed from the Morningstar® Australia Dividend Yield Focus lndex™ to the Morningstar®️ Australia Dividend Yield Focus Equal Weighted Index™️ with change to the index methodology.
The S&P/ASX 200 Index is shown for comparison purposes as it is the widely recognised benchmark used to measure the performance of the broad Australian market. It includes the 200 largest ASX-listed companies, weighted by market capitalisation. DVDY’s index is an Australian equity index of 25 high quality dividend paying Australian securities, excluding A-REITs (Australian Real Estate Investment Trusts). The Index is derived from the Morningstar® Australia Index™, a broad market index representing 97% of Australian equity market capitalisation It has fewer companies and different industry allocations than the S&P/ASX 200. Click here for more details.
VanEck’s MOAT, GOAT and DVDY provides investors with exposure to moat companies, which Morningstar has confidence will deliver excess returns over the long term. MOAT, GOAT and DVDY are high conviction strategies with low passive fees. Their unique approaches can provide diversification benefits to your portfolio.
Key risks
An investment in any of the funds carries risks associated with: financial markets generally, individual company management, industry sectors, ASX trading time differences (for international equities), foreign currency (for international equities), sector concentration, political, regulatory and tax risks, fund operations, liquidity and tracking an index. See the respective PDS for details.

