Another central bank phrase keeping markets on its toes, the neutral rate. The neutral rate is an estimate of what central bankers and economists think is the real interest rate (nominal interest rates minus inflation) that will manage inflation while supporting full employment or maximum output.
It is an estimate, so while central bankers grapple with how fast and high to take rates to, in the real world, inflation remains above target rates, interest rates continue to rise and property prices are under pressure. A fall in the property market would adversely impact Australia’s big four lenders.
To see where Australia’s property market is heading look to our neighbour
New Zealand is ahead of Australia in its tightening cycle, with the official cash rate there sitting at 2.5%, up from 0.25% at the start of October 2021. In May the Reserve Bank of New Zealand forecast an 8.1% drop in house prices for the year. This might be conservative. CoreLogic data showed that in the three months prior to the end of July, prices were down 2.5%, the fastest three months decline since October 2008.
There are two reasons this is important for Australian investors, firstly as our rates rise, so too will the value of property fall. Secondly, and perhaps surprisingly, Australian banks have an 85% share of the New Zealand market in terms of bank lending.
The trend in Australia
The rate rising environment is problematic for Australian banks. If the negative trend in property prices continues, and if the New Zealand experience is anything to go by, bank loan growth should slow.
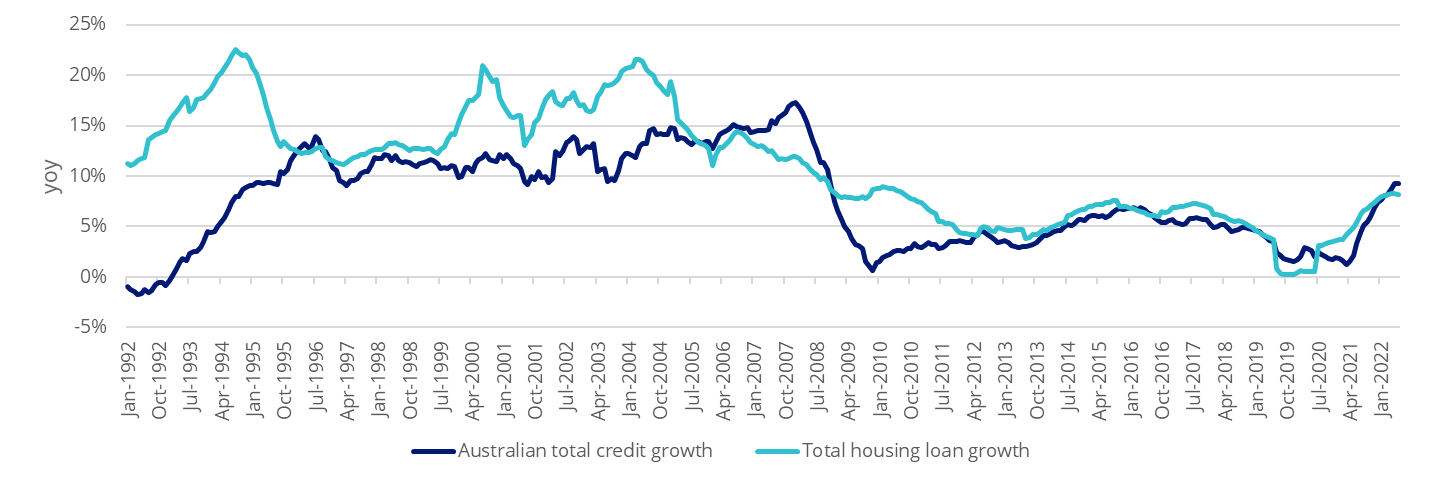
Housing loan growth slowed from 7.9% year-on-year (YoY) in May to 7.8% YoY in June, while system credit growth, a measure of outstanding loans, rose to 9.1% in June, the highest level since October 2008.
Figure 1: Australia total credit growth and housing loan growth

Source: RBA, to 30 June 2022
For years Australian banks have been able to grow their mortgage books as new home buyers looked to take advantage of record low rates. It now looks as though growth in new mortgages will slow. In addition, a fall in property prices is likely to put pressure on non-performing loans.
Australian banks’ only hope
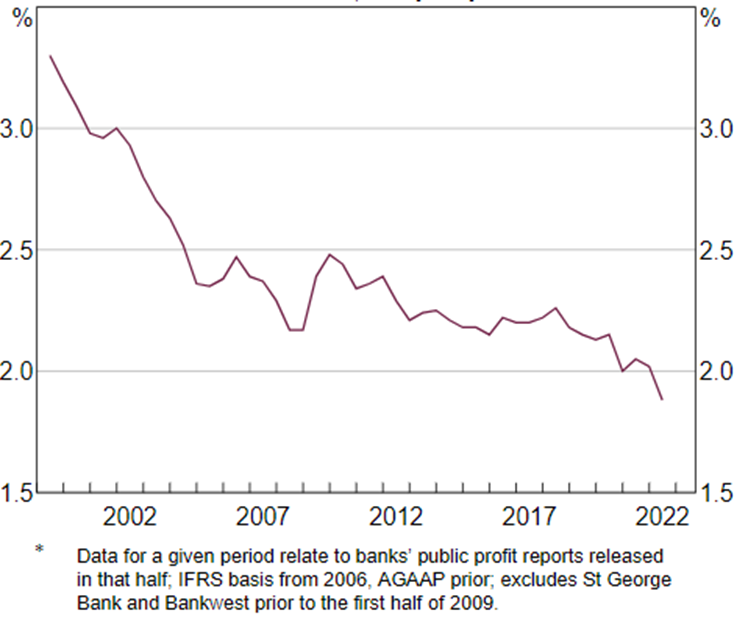
Property and credit are not the only headwinds Australian banks face. For the first time, the big four banks’ Net Interest Margins (NIMs) have dipped below 2%. The rapid increase in mortgage rates will likely increase the percentage of customers requesting mortgage relief putting further downward pressure on NIMs, as seen during the global financial crisis. A reduction in NIMs will also impair the big four’s ability to increase dividend payments.
Figure 2: Major Banks’ Net Interest Margin* (Domestic, half yearly)

Source: RBA. Data to 28 July 2022, released 3 August 2022.
It seems the only way Australian banks can make money is if they delay or increase deposit rates at levels less than the change in the RBA cash rate. As the four pillars (CBA, Westpac, ANZ and NAB) represent a fifth of the S&P/ASX 200, their earnings should be linked to robust earnings and customer growth, not external factors beyond their control.
We are not saying, don’t hold banks. They are an important part of the Australian economy and thus a key part of Australian equity portfolios. What we are saying is that having one in five dollars invested in Australian equities allocated to the banks may not be prudent risk management.
Such sector bias makes sense if you are bullish the sector, but pressures on banks remain: bank loan growth, if property prices continue their current trend, should slow and with the major banks net interest margin (NIM) below 2% there are questions on banks’ ability to increase profits.
VanEck Australian Equal Weight ETF (MVW) is a portfolio construction solution that reduces concentration risk to banks and can be deployed to de-risk and diversify with no one security or sector dominating providing a more balanced exposure to Australia’s economy.
MVW vs S&P/ASX 200 Index – A more balanced approach
MVW equally weights the largest and most liquid stocks on the ASX at each rebalance. Because of this, at last rebalance, no company was more than 1.17%. What this means is that if ANZ or CBA goes up or down 2%, its impact on the S&P/ASX 200 is greater than on MVW. MVW’s exposure to the big four banks is currently less than 5%.
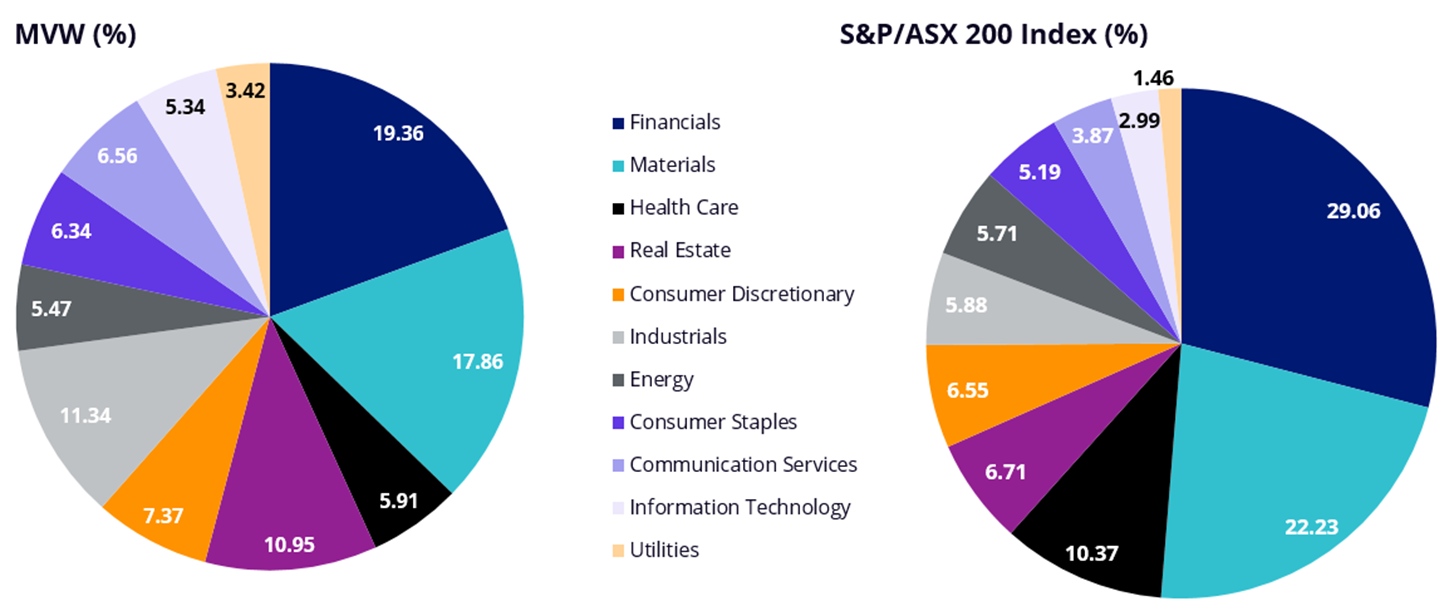
A consequence of the equal weight methodology is that MVW relative to the S&P/ASX 200 is underweight those sectors that contain larger than average companies. For example, MVW is currently underweight the financials sector by 9.70% compared to the S&P/ASX 200. Conversely it will be overweight sectors that contain smaller than average companies. MVW is currently overweight industrials by 5.46% and information technology by 2.35%. Therefore, MVW has less sector concentration risk than the S&P/ASX 200.
Figure 3: S&P/ASX 200 and MVW sector weightings (%)

Source: FactSet, 31 July 2022
Should the economic environment become more favourable for banks, you can add to your portfolio by buying your preferred bank directly as satellite positions to MVW, or you could add the VanEck Australian Banks ETF. In this way ETFs are efficient tools to express portfolio ideas for the prevailing economic environment.
Irrespective of the stage of the economic cycle, MVW is designed to be a long-term portfolio solution. Since its inception in 2014, to 31 July 2022, MVW has outperformed the S&P/ASX 200 Index by 173 basis points. As always, past performance is by no means a reliable indicator of future performance.
Table 1: MVW Performance
| 1 mth (%) | 3 mths (%) | YTD
(%) |
1 yr
(%) |
3 yrs
(% p.a.) |
5 yrs
(% p.a.) |
7 yrs (% p.a.) |
Since inception (% p.a.) | |
| VanEck Australian Equal Weight ETF (MVW) | 6.82 | -6.20 | -3.96 | 1.69 | 4.47 | 8.23 | 8.61 | 8.99 |
| S&P/ASX200 Accumulation Index | 5.75 | -6.04 | -4.75 | -2.17 | 4.27 | 8.03 | 7.10 | 7.26 |
| Difference | +1.07 | -0.16 | +0.79 | +3.86 | +0.20 | +0.20 | +1.51 | +1.73 |
Inception date is 4 March, 2014. Source: Morningstar Direct, VanEck as at 31 July 2022. Results are calculated daily to the last business day of the month and assume immediate reinvestment of all dividends. MVW results are net of management fees and other costs incurred in the fund but do not include brokerage costs and buy/sell spreads incurred when investing in MVW. Past performance is not a reliable indicator of future performance.
Key risks
An investment in the ETF carries risks. These include risks associated with financial markets generally, individual company management, industry sectors, fund operations and tracking an index. See the PDS for details.


