Gold continues to perform well in US dollar terms and even better in Australian Dollar terms and the backdrop to a higher gold price is only strengthening. It, along with the “yield crunch” thematic I have discussed here all year long are my two favourite broad market trends that present an enormous opportunity for investors.
And in a sense both are inter-related because as the Federal Reserve, RBA, ECB and virtually every central bank around the world have shown, the ability to normalize interest rates since the GFC has been impossible. In fact all it has done is created another debt explosion by Governments (up 75% since the GFC), corporations (up 50%) and consumers (up 7%), without having the expected impact on economic growth. Now the global growth is slowing, the world is pregnant with debt and central banks are limited in their options to be able to stimulate growth. Can we take on any more debt? I would think not, hence why consumer debt growth has been relatively small, reflected in poor retail spending numbers for years.
Lower interest rates, high debt levels, slowing growth are all aspects that make gold an attractive alternative investment and below we can see on the weekly chart the formation where gold is on the brink of a multi-year breakout. As I noted in my recommendation on Newcrest Mining (NCM) – “As I stress to my traders in the office, the formation on NCM take years to develop……..if I am correct and this does explode higher and you are not part of this once in a multi-year rally, frankly, there are no excuses to let such an exceptional opportunity pass” – this applies to the gold price as well.
This multi-year base formation stretches back to 2013, which represents six years in the making. While there have been false starts before this not only looks the most constructive, but the global market conditions are most supportive for a breakout then they have in the past. It may still take a few weeks for the ultimate confirmation of a breakout to occur, but I believe that this is the time to be accumulating gold or gold positions. Regular readers would know that we have already been doing this with positions in Newcrest since the early part of this year. At almost $30 dollars it has been outperforming the gold price substantially. In fact of the major gold producers around the world it has been the leader.
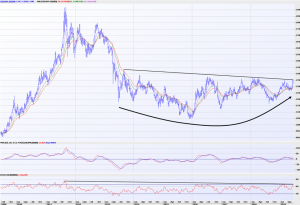
So how far can gold rally? There are a lot of gold bugs out there which continually target to reach levels into the thousands of dollars, but let’s dial it back a notch and look at some levels we have to reach first on the way to any of those exuberant targets. As we saw with Newcrest a breakout of this duration and formation should see at least a retracement back to the Fibonacci (61.8%) level of the entire 2011 to 2015 decline. Newcrest hit its Fibonacci equivalent today (just shy of $30) and on gold that level would be US$1590 or a $240 gain from current levels.
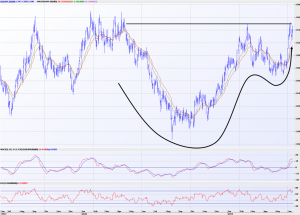
How probable is a near term break? Let’s consider the daily chart and we can see any weakness has continued to hold the 10-day exponential moving average, a moving average I use regularly to reflect strong short-term momentum if prices can stay above that. We have that with gold. Also this latest formation is a small cup and handle formation – within the large cup and handle formation on the weekly charts above. We had that on Newcrest too. This tends to emphasize that the short-term breakout could evolve into a large long-term trend. Great risk/reward ratio potential. It is in these situations you tend to be more aggressive with position sizing too as short-term positive momentum could easily explode while we are able to keep relatively tight stops. I wouldn’t want to see gold under US$1265 – but honestly US$1300 should now be firm support.
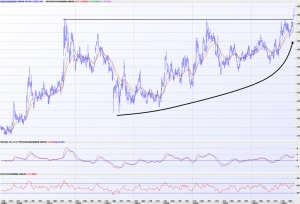
If you really want to be excited with gold look at it in Australian dollar terms. The ASX listed ETF in Australian gold terms – GOLD.ASX – is shown below on a weekly chart and fresh new record highs are in place because of the local currency’s weakness. This helps explain why Newcrest has been so strong. The breakout here through multi-year highs has since seen a surge and I would suspect the same could be seen in the US dollar gold price once through US$1380. With my negative view on the Australian dollar this should be nothing but a spectacular windfall for Australian gold producers.
Could conditions be any sweeter for Australian gold miners and local gold investors? To be a part of it in the simplest way buy GOLD.ASX. My favourite gold miners amongst the large caps are NCM, EVN while at the smaller end SLR, MML and RED appeal.