
by Tim Toohey – Head of Macro and Strategy
As we approach the end of the financial year it is important to recognise some of the remarkable achievements the Australian economy has ticked off relative to its developed countries peer group.
- Economic growth has continued to surprise the consensus, rising 1.8% in the March quarter to be 1.1% above the same time in 2020;
- Financial wealth has risen 7% since COVID-19 commenced and housing wealth has risen 11% over the same period, helping to underwrite historically high levels for consumer confidence;
- Employment is above pre-COVID levels and the unemployment rate has declined sharply from its peak of 7.4% in July 2020 to 5.5% currently. This compares to 5.3% pre-COVID;
- Business conditions, trading conditions and profits currently stand at record levels, according to the NAB survey;
- Business investment intentions have recovered solidly in recent months and are currently consistent with investment expanding by 12% in 2021-22;
- Australia’s external accounts remain near their best since records commenced in 1959. The current account surplus stands at 3.3% of GDP with the trade surplus currently 4.8% of GDP. Strong commodity prices have assisted this outcome, with the terms of trade the highest since December 2011;
- This strength in export income has boosted nominal income growth and helped in delivering significantly lower fiscal deficits relative to the Government’s forecasts.
Since April 2020, we have been forecasting the Australian economy would expand rapidly in 2021. The developments in the past quarter leave us comfortable that Australia will achieve our well-above consensus economic growth forecast of 6.0% for calendar 2021. We also remain confident that the RBA and consensus will again upgrade their growth views in coming months.
Despite all this very encouraging economic news, the most interesting aspect is that the recovery has occurred with ‘excess household savings’ of $171bn accumulated since COVID-19 commenced. To put this into context, this is equivalent to a massive 12% of household income.
Before we go too much further into the derivation of the ‘excess saving’ figure, a quick review of two important concepts is warranted.
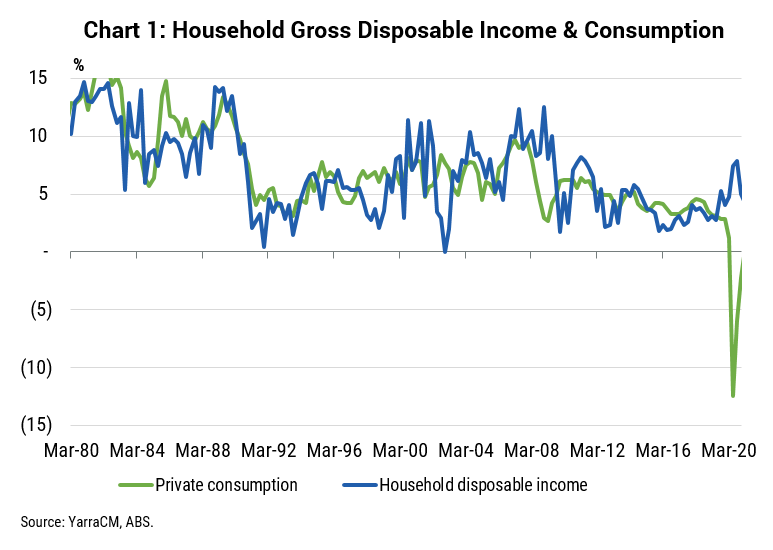
Firstly, when statisticians refer to ‘household saving’ it is important to remember that this is a flow concept. That is, it records how much of income after tax and interest payments is left over each quarter after deducting how much is consumed. As Chart 1 shows, if you can’t consume the things you want, such as travel or entertainment, and most people remain gainfully employed, then saving must rise. Of course, the chart also shows the unusual strength of household income since the commencement of COVID-19, a result that is mostly a function of strong government payments and lower interest payments.
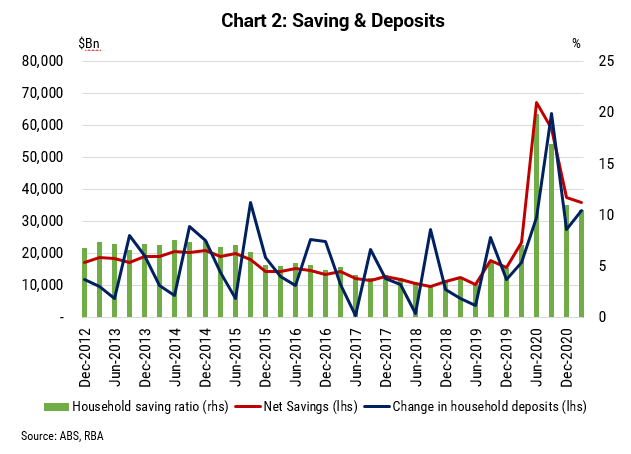
The household saving ratio is not a measure of wealth. It is not even a measure of household saving accounts at the bank. Its closest parallel is the change in bank deposits each quarter (Chart 2).
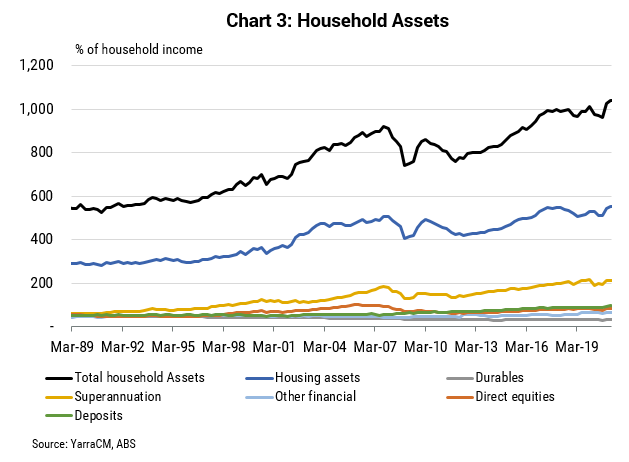
Secondly, when economists refer to ‘household wealth’ they are referring to gross assets by all households inclusive of; houses, superannuation, direct holding of financial assets, cash and term deposits, and durable assets such as motor vehicles and household furnishings. That is, wealth is a ‘stock’ concept.
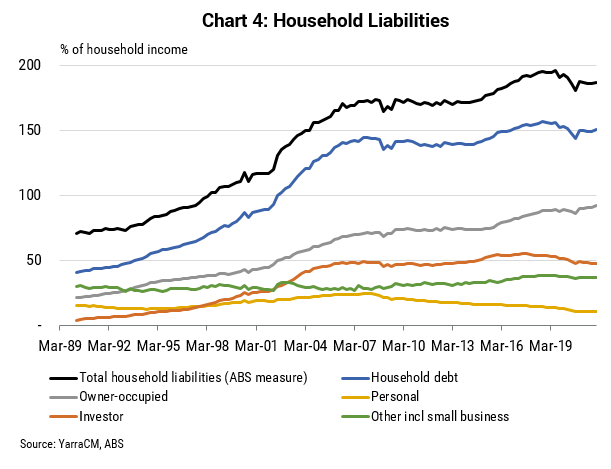
‘Net wealth’ is the stock of gross household assets minus the stock of household debt. However, a casual glance at Chart 4 reveals that debt has not expanded at a rapid rate relative to income. Indeed, the only category that has increased is owner occupied housing debt. All other categories are either steady or falling as a share of income.
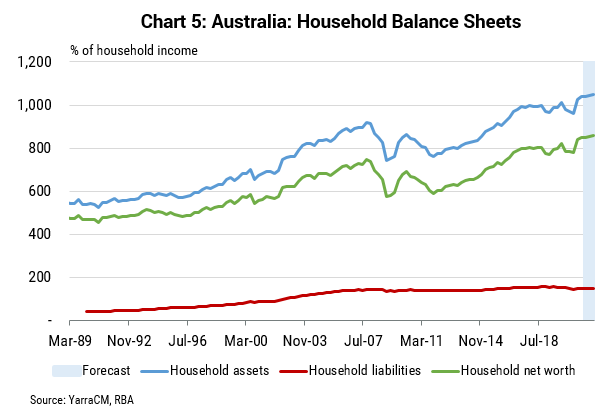
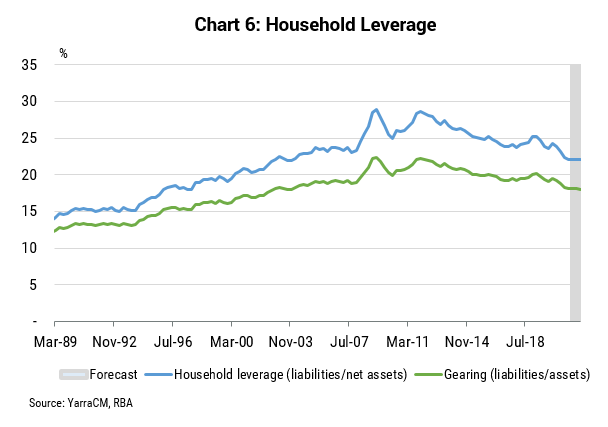
If we take this a little further and plot gross assets, gross liabilities and the net position of households (Chart 5), it is hard to see why policy makers, economists and the media collectively wring their hands over the rise in household debt. It is hard to see the rise in household debt at all when charted on the same axis as assets. Indeed, the far bigger story has been the rise in net assets. This rise in assets relative to debt has returned household leverage and gearing to levels last seen in 2003 (Chart 6).
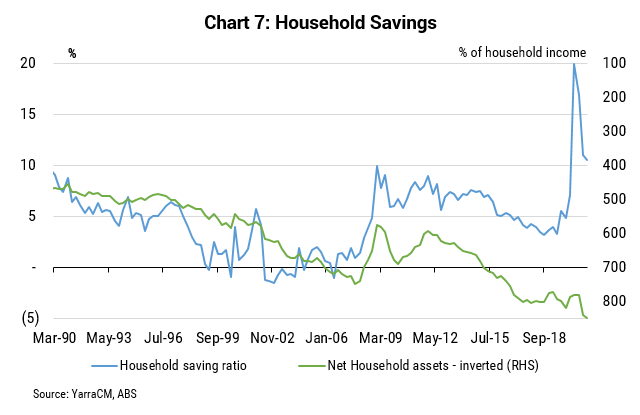
Naturally when households feel wealthier they tend to be happier to consume a larger proportion of income. This inverse relationship between wealth and saving is shown in Chart 7 and raises a number of questions, perhaps most notably why has there been a step change in the relationship since the global financial crisis?
Obviously the surge in government support during COVID-19 explains the recent divergence, but the gap has been more persistent than prior to this crisis. We agree with the conventional economic theory which suggests that households only consume unexpected wealth gains that are perceived as being permanent. Proximity to the financial crisis and the use of unconventional policy tools by central banks has likely led households to believe that wealth gains may not be permanent and hence consumed less than they would have done prior to the financial crisis.
It is also feasible that demographics are playing a larger role. As Baby Boomers have approached and entered retirement it is likely that their consumption patterns change as they look to finance a long period without regular wage income. As such, it is unlikely that the saving rate will decline to the levels implied by net asset gains. Nevertheless, it is not unreasonable to expect the saving rate to decline to ~5% over coming quarters.
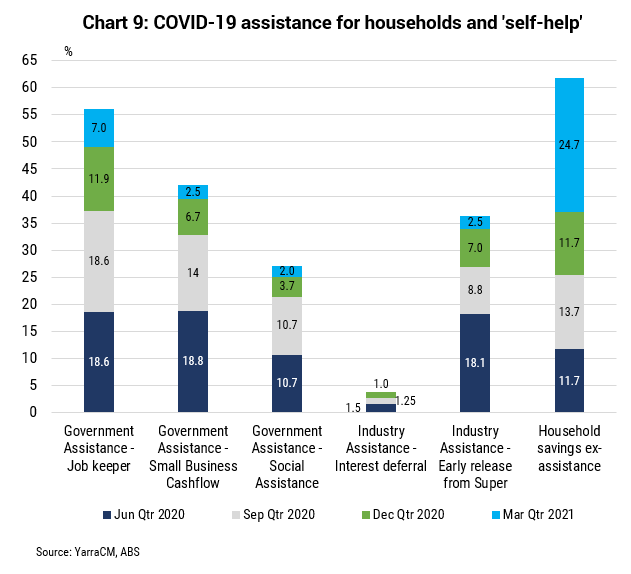
In Chart 8 we breakdown the saving rate into how much of the recent rise can be attributed to government stimulus payments, including industry measures (e.g. Early Release from Super and interest rate deferments) that are in addition to the way the ABS statisticians officially measure savings.
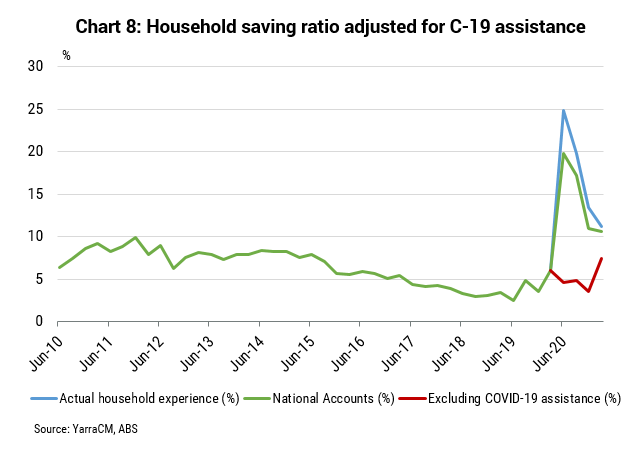
By subtracting these payments and subsidies, it is clear that households’ underlying savings behaviour was largely unchanged. That does not mean that the people who received the payments didn’t spend them. Rather this provides the aggregated response across all households. No doubt those who needed the payments spent most of these funds relatively quickly, however, this has been more than offset by those who were able to build a precautionary buffer in savings by either consuming less than they earned or via selling other assets.
In other words, in aggregate almost all of the rise in household saving since the start of COVID-19 can be traced to government and industry assistance.
Specifically, JobKeeper provided 25% of the increase in savings, small business cash flow payments provided 19%, Early Release from Super provided 16% and other welfare assistance payments provided 12%. Although interest deferrals were relatively small, contributing 2%, they were important in helping to avoid a destructive cycle of defaults.
If we hold household saving at the same trend level as pre-COVID, then we can state that of the $227bn rise in household saving since March 2020:
- $125bn can be attributed to government assistance;
- $40bn can be attributed to industry assistance; and
- $6bn can be attributed to additional precautionary savings behaviour (see Chart 10).
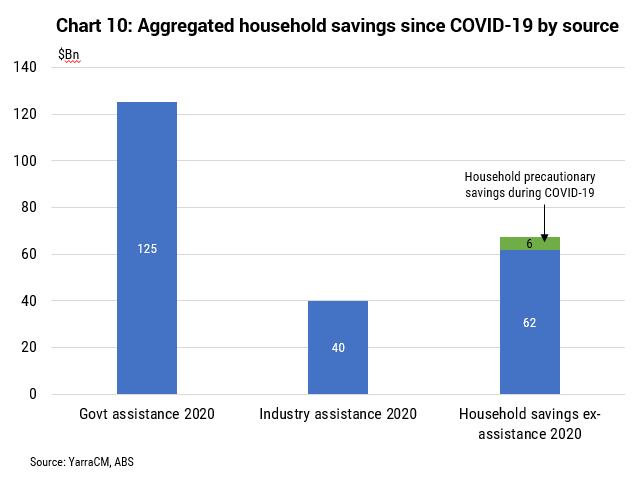
That is, household excess savings amounts to a massive $171bn – or 12% of household income!
In other words, should households choose to run down their stock of ‘excess’ saving, Australia could achieve above trend-like consumption growth for over two years, even if household income growth is stagnant.
But how do we know households will actually spend it?
There are two strong reasons why we believe they will spend it. Firstly, because spending remains at a historic gap to what traditional economic fundamentals suggest would typically have been spent. Secondly, because household surveys are telling us they will spend it.
Let’s quickly address the first reason. Consumption is typically modelled as a function of disposable income and wealth. However, most models of consumption in Australia and overseas have historically struggled to find a stable and correctly signed relationship with wealth, particularly when split between housing and financial wealth, partly due to the co-movement between different forms of wealth. This time around we also have the added issue of the cessation of net migration.
We get around this issue by modelling per capita consumption as a function of housing wealth, financial wealth and disposable income at the State level. This increases the number of observations by a factor of six, and by estimating the function as a pooled regression we get far more robust and sensible results. In short;
- A 1% rise in income results in a 0.55% increase in consumption;
- A 1% rise in financial wealth results in a 0.13% increase in consumption; and
- A 1% rise in housing wealth results in a 0.08% increase in consumption.
Half of the consumption benefit from housing wealth occurs within six months and approximately half of the consumption benefit from financial wealth occurs within 18 months.
Financial wealth has risen 7%, housing wealth has risen 11%, and household income has risen 6% since Dec-2019. This suggests consumption should be greater than 6% above pre COVID-19 levels, even if we assume no further decline in the household saving ratio.
In simple terms, we have never had such a wide gap between what the fundamentals of income and wealth suggest for the level of consumption than what we have witnessed in the past 12 months. The economic rationale for a very robust period of consumption spending are as strong as any other period we can identify since the late 1980s.
The second reason to believe that households will spend their excess savings is that survey data shows that they are revealing their preferences to do precisely that. Specifically, the ABS conducted a comprehensive survey in April which revealed that over the next 12 months, household expect their incomes to rise, savings to decline and spending to increase. A snapshot of some of the results of the survey include;
- 25% of households expect their income to increase over the next 12 months compared with 10% expect their income to decline;
- 31% of wage earners expect their incomes to increase compared with 15% of welfare recipients;
- Higher paid workers are expecting larger income gains than lower paid workers;
- Just 52% of workers expect to be able to save some money over the next year, suggesting the saving rate will decline in aggregate;
- 22% of households plan to use savings to finance travel, while 15% plan to renovate their home and 10% plan to buy or build a new home;
- 29% of Australians expect their household spending to increase, while only 8% expect a decline; and
- 34% of low income earners expect to increase their spending compared to 28% of high income earners.
The bottom line is the economic fundamentals and the survey data are both providing very strong evidence that the current resurgence in consumer spending will not peter out in coming months. The buffers that households have accumulated during the pandemic and the unexpected wealth they accumulated has coalesced with a remarkably strong labour market and sharply recovering dividend income receipts. We continue to expect real consumption growth to average 7% in 2021 and 5% in 2022 – a boom of historic proportions.

