
The March of fear
The initial failure of Silicon Valley Bank, followed by Signature, and then Credit Suisse, has many investors worried about a second global financial crisis. A generation of would-be Michael Burrys, educated and influenced on a steady diet of watching “The Big Short”, have been looking for a potential culprit – naturally their gaze falls on real estate.
The concern is almost $3 trillion of commercial real estate loans sit on US bank balance sheets – a disproportionate amount of which is with smaller, less well capitalised banks. The concern is that since office buildings are being abandoned by their tenants, it follows that they will soon be abandoned by their owners, landing on bank balance sheets precipitating a credit crisis, a collapse in several banks, real estate values, and ultimately, another credit crunch.
Scary stuff.
In this article, we look past pop culture and the headlines, and focus on what we do best – data. Are there troubles ahead in commercial real estate? Probably. Is there another GFC on our horizon? Keep reading to find out what we think.
Basic mortgage maths (or ‘math’ for our US readership)
Before we get into the data, let’s do a quick review of commercial real estate mortgage lending (recognising not all commercial loans are mortgages, but many are).
Like residential mortgages, the repayments generally include principal and interest, typically over 25 or 30 years. However, unlike residential, often the loan will expire before the 25-year amortisation schedule (say five to seven years). On expiry, the principal may be amortised by as much as ~10% (see left chart below).
Putting some numbers around this, on the right table below, we show an initial loan of $100 levered to 65%[1] in year 0. We assume the asset initially yields 5%, and is financed with a pandemic induced all in rate of 3%. In five years, we can look at two scenarios – one where the asset value is maintained and income has increased by 3% per annum, and one where the income and value has declined by 20%. Under both scenarios, we assume a refinancing rate of 7%.
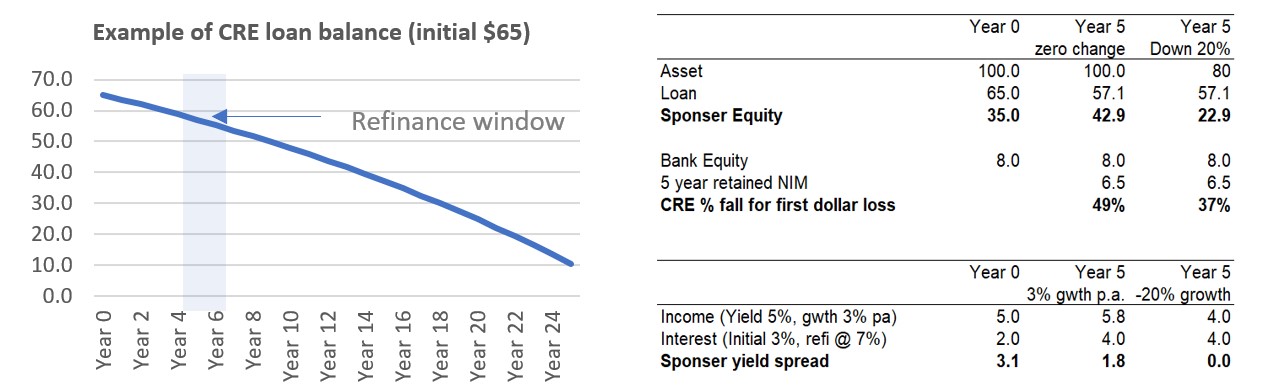
Source: Quay Global Investors
From a bank perspective, we assume for each $100 of loan, the bank provides $8 of equity. We further assume the bank earns, on average, 2% net interest margin (NIM) over five years. The cumulative NIM assists as an equity buffer against any loss.
A couple of observations:
- Assuming moderate rent growth and zero value appreciation over five years, sponsor equity is substantial ($42.9 per $100 of initial asset value). And refinancing from a 3% rate to 7% still leaves significant income spread, with enough cashflow to maintain amortisation. It’s still a very profitable business for banks to roll such loans, even in a substantially higher interest rate environment.
- In a bearish -20% scenario (income and asset value), there is enough income to service the interest and still have significant equity for the sponsor to protect (i.e., sponsor will attempt to avoid default).
Options for a sponsor under the second scenario are many, but it’s most likely a bank will lend to 50-60% LVR on the new asset value ($40-$48), along with a contribution of new equity from a sponsor, or JV partner, or even some mezzanine debt. The sponsor is incentivised to find alternate capital or walk away from $22.90 of equity in a down market. If the sponsor cannot source such capital, the bank can sell the mortgage book (at par or at a small discount) to remove the loan and default risk from the balance sheet.
Either way, the asset value will need to fall a further 37% (following the initial 20%) before the bank faces any asset impairment.
Now, let’s dig into the numbers
The following charts dimension the scale of commercial real estate lending for US banks. The left chart is total real estate loans (CRE) with US banks (almost $3T), while the right is loans with smaller / regional banks ($2T).
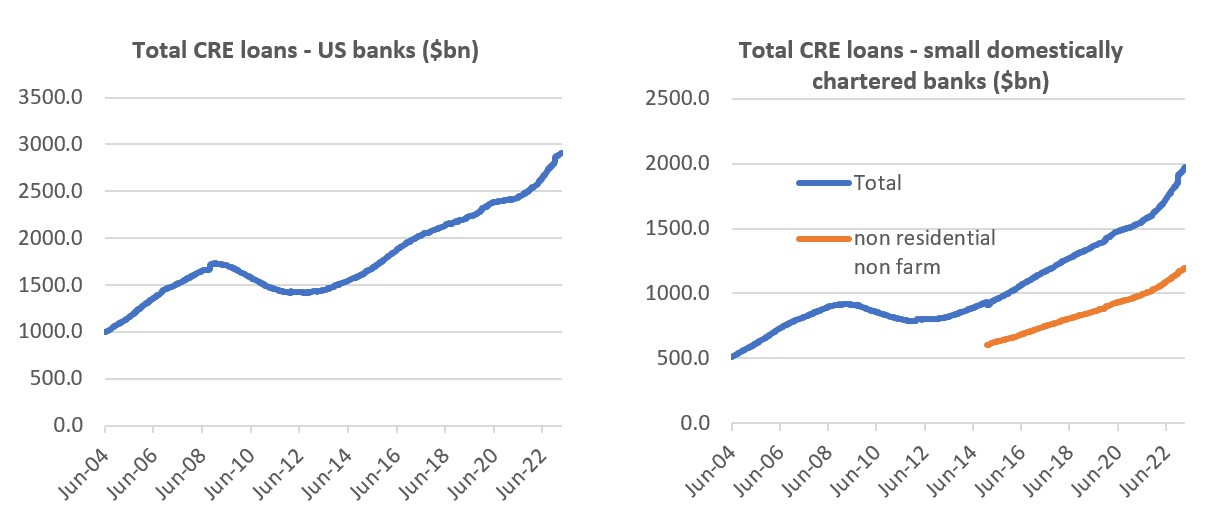
Source: US Federal Reserve, St Louis Fred, Quay Global Investors
The chart on the right is where there is some concern. These banks are significantly smaller than the majors, yet carry a disproportionate share of the real estate loans. These loans include multifamily and rural loans which are unlikely to suffer any significant stress (from a lending perspective), especially since multifamily rents have increased by near double digits per annum for the last two to three years. We suspect there is plenty of equity in these loans.
Therefore, non-residential commercial real estate loans work out to be a little over $1 trillion. This includes office, retail, self-storage, industrial, service stations, restaurants, hotels, data centres, and the remaining spectrum of commercial real estate.
However, office and retail make up a large proportion of these loans (according to JP Morgan research, roughly 40% and 25% respectively). While there may be some issues with retail, most of the focus is on the office space – or $400bn of office loans.
So, how bad can it get?
The following two charts put these loans into context. The left shows the historic delinquency rate of commercial loans since 1991 (the height of the savings and loan crisis), through the GFC, to today. The second is the amount of equity (assets less liabilities) of the same small regional banks. Currently, this is just under US$700bn.
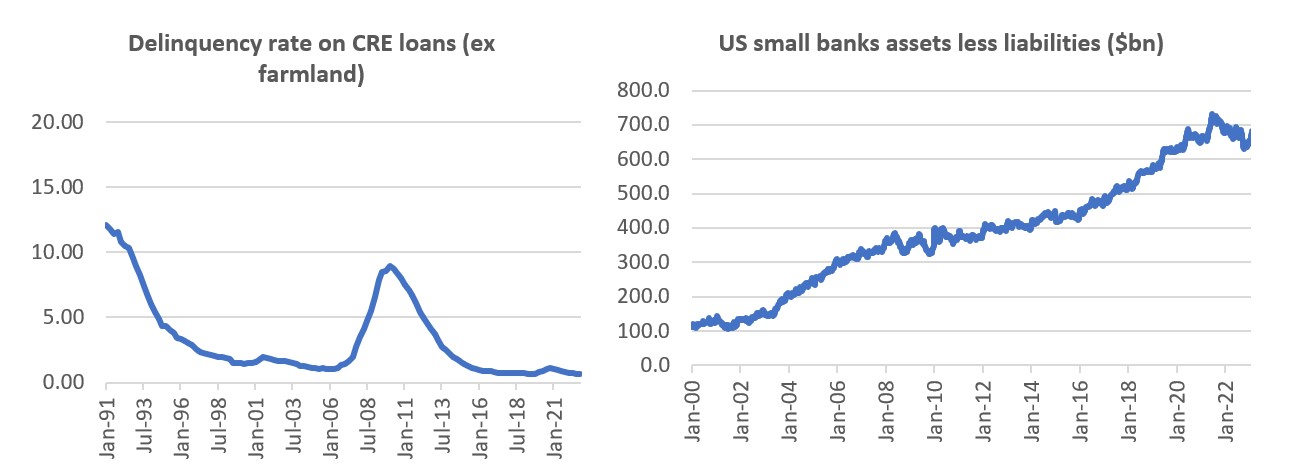
Source: US Federal Reserve, St Louis Fred, Quay Global Investors
Using this as a starting point, if we assume a delinquency rate[2] on all office loans of around 15% (an all-time 30 year high), which seems conservative enough, the next assumption is recovery rate. Of the loans that fall past due, not all suffer a loss. Banks could recover the amortised loan amount (by now, an amount substantially below the initial asset value as described above), or the loan could be sold to financial specialists that work out high leverage assets at or close to par.
But we must make an assumption. Using our earlier example of a loan with initial 65% leverage, we can run scenarios for various asset level declines to calculate the dollar impairment on the delinquent loans, and more importantly, the percentage of equity.
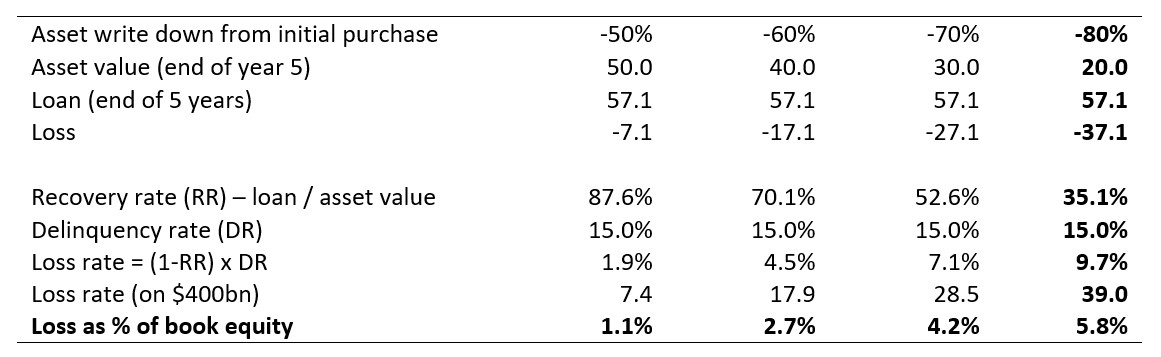
Source: Quay Global Investors
What does this mean?
Looking at the right side of the table, assuming a 15% delinquency rate (a 30 year high) with a corresponding 80% decline in office value, banks would face a $39bn loss – which in turn represents just over 1/20th of their book equity. Hardly a disaster.
Some caveats
Obviously, this analysis is based on aggregate data from the US Federal Reserve, and as such, makes no assumption or comment about individual bank exposure. Clearly, banks with higher exposure have higher risk, and eventually may generate more headlines.
Secondly, delinquency rate and asset values are not independent variables. As one rises, the other factor rises with it. If all office values fall by 80%, it can be argued the delinquency rate may well be higher.
On the positive side, the losses assumed (if any) are cumulative, and are likely to occur over several years. Meanwhile, banks will continue to earn yearly net interest margin (NIM) and return on equity from other loans, courtesy of existing lease duration to buffer/offset the losses.
This is an important distinction from the housing crisis in 2008-9, where non-income producing mortgages with no lease duration defaulted very quickly (and where loan values were sometimes higher than the initial loan due to so-called ‘teaser rates’).
And while office is indeed challenged in the current environment, we do not believe ‘work from home’ culture will spell the end of the asset class (as explained in our article, Thinking about office). Anecdotally, industry contacts inform us today that some of the major cities in the world have recovered to near 90% peak day occupancy (such as London, New York and Boston), while leasing volumes – while down on pre-COVID levels – are not disastrous.
As the following charts highlight, office leasing volumes across major markets (proxied by Boston Properties) are back to pre-COVID levels, albeit with softer rents. The second chart shows stress in private label CMBS remains very low – probably reflecting initial conservative underwriting, since as an asset class, office was a poor performer in the decade prior to the pandemic. Again, another distinction from the 2008-09 housing crisis.
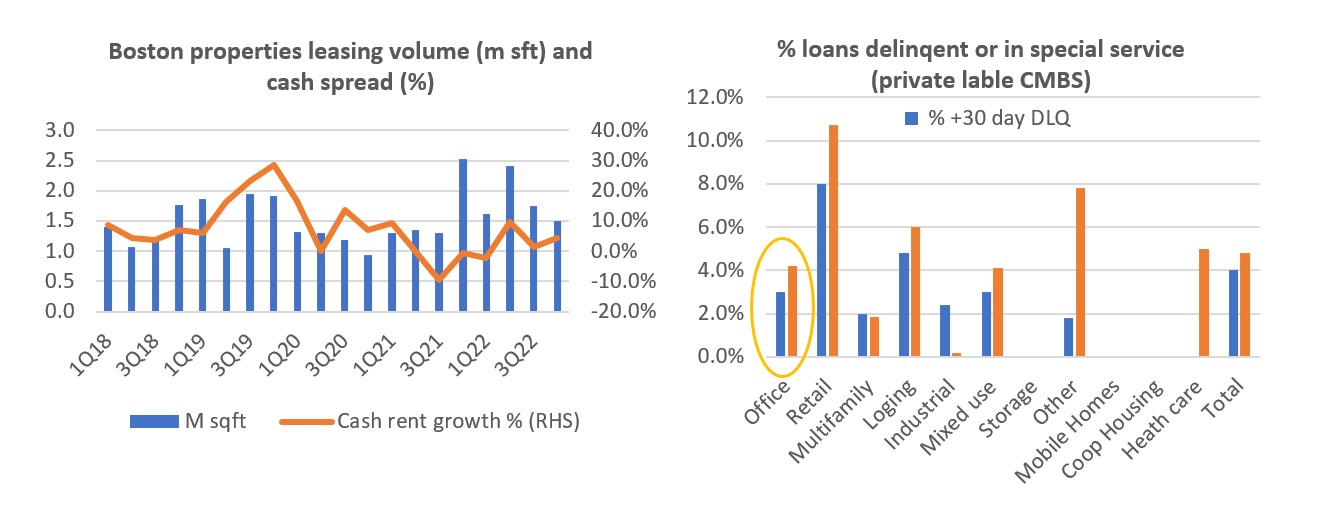
Source: JP Morgan, Trepp, company data
Solvency does not equal liquidity
Finally, solvency does not equal liquidity.
As we have seen from other bank failures, if depositors flee, then despite high quality loan books a bank will run short of reserves and be unable to settle transactions on behalf of customers. This is not disastrous so long as the interbank market continues to function, and the loss of deposits are lent back (in aggregate, the money never disappears).
As the charts below highlight, this is beginning to happen to the smaller banks (although the recent step down in deposits for the perioded ended March 15 largely reflects the Silicon Valley collapse on March 10). The chart on the right shows that loss of deposits are currently covered by increased loans (almost certainly from the Central Bank and other US banks) showing the interbank market, for now, is functioning as it should.
The lesson here is: banks can fail irrespective of asset quality. Until regulators and the government mandate something that resembles near 100% reserve backed deposits (while ensuring discipline on the asset side of the balance sheet), then pretty much all banks, globally, are vulnerable.
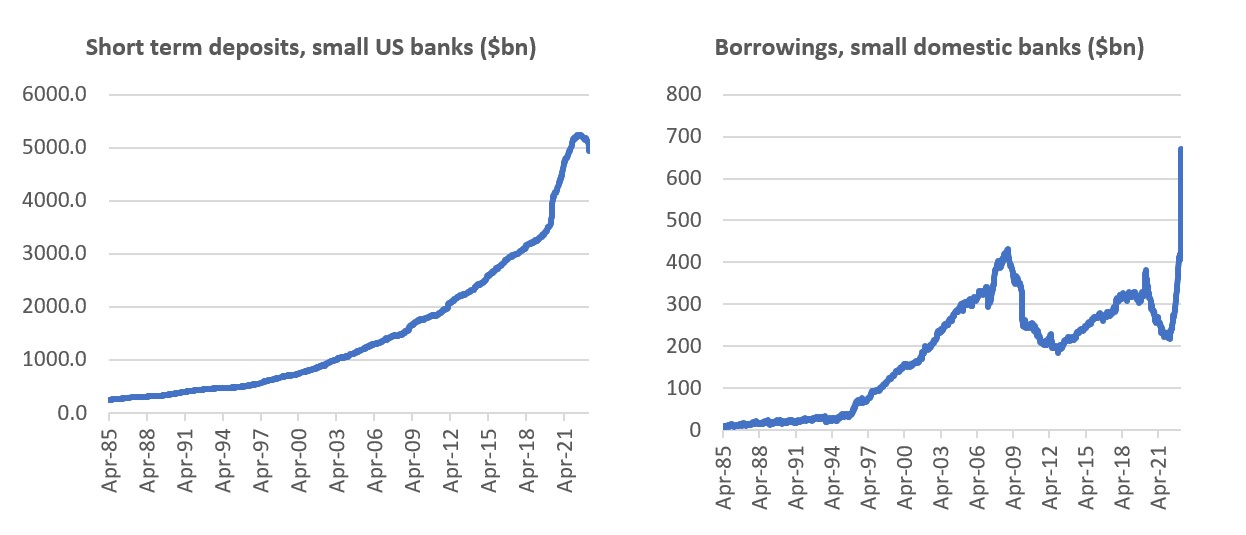
Source: US Federal Reserve, St Louis Fred, Quay Global Investors
Does the uncertainty mean credit will become rationed?
While our broad analysis suggests small commercial banks may be able to manage the losses, there is a fear that appetite to maintain or extend more credit will be compromised – at least in the short term.
This is a fair expectation.
However, it’s important to get the technicals of modern banking right. It’s tempting to observe the recent drop in deposits of the smaller banks and conclude they will not have the funding to maintain lending. This is not true – deposits are not required to make a loan. The loan creates the deposit. Banks create their own deposit base via the lending process. The limit to extending credit is risk appetite and equity risk capital.
In a tighter lending world, assets that are highly leveraged may be required to find additional funding (equity / mezzanine), where old equity holders will be diluted. However, we believe there will still be appetite for lending from larger banks as well as the smaller banks. Outside of office, the underlying performance of real estate globally is generally good and cashflows are robust. And as our earlier example shows, refinancing debt from 3% to 7% after five years is easily covered by moderate growth in rental cashflows.
This is in stark contrast to the housing crisis in 2008 where housing and defaulted mortgages had almost no income, and a shortage of credit worthy borrowers in an 11% unemployment economy.
Most REITs (although not all) have learned the lesson of 2008 and have access to liquidity via cash on hand and undrawn lines of credit. They can therefore continue to operate with access to capital in the near to medium term.
How is Quay approaching the current environment?
Fear can be rational or not. Either way, it can create opportunities and risk.
Across the portfolio we instill a strong valuation metric across all our investees, with a focus on cashflow, replacement cost, management, and a favorable thematic. Recent falls simply means we now hold these companies at deeper discounts to valuation.
We also bias portfolio construction toward companies with strong balance sheets. This is more than a ratio. As we’ve highlighted in this article, banks can and do run into liquidity issues quickly, and credit appetite may soon become constrained given recent events. Focusing on the debt profile and access to liquidity can be just as important as any ratio, and can ensure the company can continue operations without sourcing new capital.
The below chart on the left highlights the percentage of debt (fixed and variable), debt maturity and liquidity across the current portfolio in aggregate. For reference we have included a chart of the domestic A-REIT index on the right. On a weighted basis, only 5% of existing debt across our investees is currently up for renewal this year, with some of the larger amounts covered by yet-to-be-settled asset sales (Big Yellow / Chartwell).
Moreover, around 20% of all debt across our investees is covered by standing cash and existing credit facilities (c$40bn). Therefore, in most instances, if credit were to become unavailable or restricted, we believe most of our investees will be well placed.
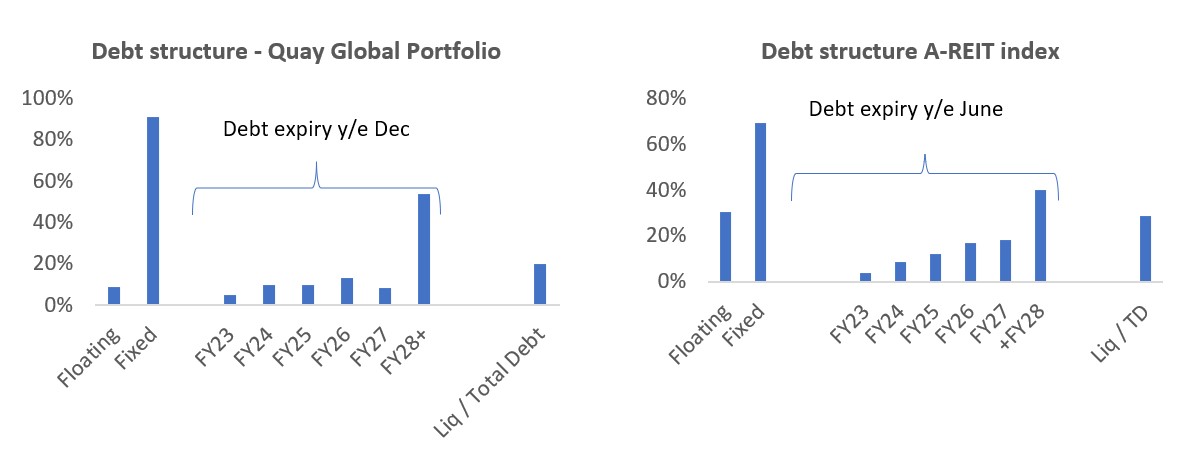
Source: Company reports, Quay Global Investors Note: A-REIT index excludes GMG due to the relative low exposure to passive income

