
by George Maris and Julian McManus
For the first month of 2023, equities acted as though the good old days of low inflation and low rates would soon return. Broad measures of inflation were declining, particularly in the U.S., and in January, the Federal Reserve (Fed) slowed its pace of rate hikes to a quarter point, raising hopes that tightening measures could be winding down.
But it didn’t take long for the present to come sharply back into focus. In January, U.S. jobs gains totaled a surprising 517,000, more than double consensus forecasts and pushing the unemployment rate down to a more than 50-year low. Meanwhile, although U.S. inflation dropped from a year-over-year high of 9.1% in mid-2022 to 6.4% in January,1 the Consumer Price Index remains well above the Fed’s 2% target. What’s more, much of the decline can be attributed to disinflation in goods such as oil and used cars – categories that experienced an unusually rapid pace of price increases coming out of the pandemic that could not be sustained indefinitely.
In other words, “the good old days” don’t look to be returning anytime soon. Fed Chairman Jerome Powell acknowledged as much during a panel discussion in Washington, D.C., when he said getting back to a 2% inflation rate “is likely to take quite a bit of time. It’s not going to be smooth. It’s probably going to be bumpy, and we think that we will need to hold policy at a restrictive level for a period of time.”
A bumpy way to 2%
We’d argue some bumps could be caused by structural changes in the economy, and these shifts could keep the 2% goal out of reach for a while. Deglobalization, for example, is adding to manufacturing costs as supply chains get rerouted away from the lowest-cost producers. The greening of the global economy is capital- and commodity-intensive and highly regulated, both inflationary influences. An aging workforce could lead to sustained labor shortages and drive-up wages: Between 2015 and 2050, the percentage of people over 60 will nearly double from 12% to 22% worldwide.2 And a lack of productive investment over the past decade in mining and energy is making raw materials especially vulnerable to supply shocks, contributing to price volatility.
Rather than consider these long-term shifts, markets – for now – are focused instead on headline numbers. As such, with headline inflation retreating, the S&P 500® Index is up 8% so far this year; the Euro STOXX 50 has climbed 12% and the MSCI World IndexSM has returned just over 8%. Bonds also appear relatively optimistic, with the Bloomberg U.S. Treasury Total Return Index up 1.2%.3 Furthermore, rates markets expect the Fed’s benchmark rate to peak in mid-2023 and begin to decline in September. In contrast, during the January/February Federal Open Market Committee meeting, Mr. Powell emphasized it would not be appropriate for the central bank to cut rates this year unless inflation falls drastically in the coming months.
Taking the road less traveled
We caution investors against getting caught up in the herd mentality of the market or anchoring themselves to the conditions of the pre-pandemic economy. The inflationary pressures discussed earlier – and as manifested in the jobs report in January – could supplant the ultra-easy monetary policies of the past decade. Put another way, should commodities get squeezed, labor shortages persist, and manufacturing and operating costs rise because of deglobalization and/or regulation, the Fed and other major central banks may have little choice but to keep rates higher for longer. Such an outcome could potentially slow growth and weigh on corporate earnings (at least in the near term) and will certainly impact equity valuations.
To that point, some indices may now be getting ahead of themselves. As of mid-February, the S&P 500 traded at a price-to-earnings (P/E) ratio of 18.3 based on forward, 12-month estimates for earnings.4 Historically, when the 10-year Treasury yielded 4%, the S&P 500 has a P/E of roughly 16 (see Exhibit 1). With the 10-year now at 3.7%,5 the S&P does not seem like a bargain.
Exhibit 1: Relationship between 10-year U.S. Treasury and S&P 500
Over the long run, a 4% yield on the 10-year Treasury has typically aligned with a P/E of 16 for the S&P 500.
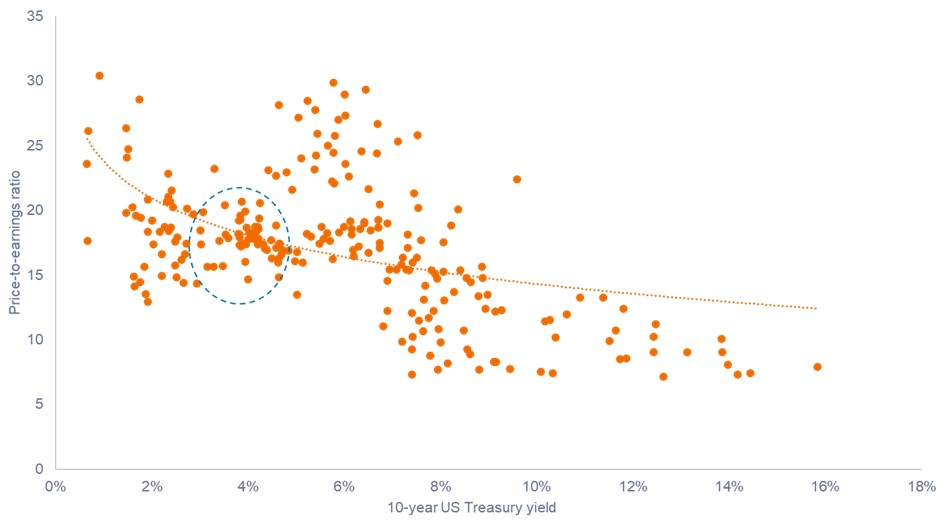 Source: Bloomberg. Regression based on quarterly data from 30 March 1962 to 30 September 2022 of 10-year U.S. Treasury yields and trailing 12-month P/E ratios of S&P 500, which is highly correlated with forward-looking multiples. Price-to-earnings (P/E) ratio is a popular ratio used to value a company’s shares compared to other stocks or a benchmark index. It is calculated by dividing the current share price by its earnings per share.
Investors may get away with paying up for stocks when interest rates are near zero, but that is a riskier proposition at higher yields. As such, in the current environment, we think the price you pay for an asset relative to a company’s ability to generate cash is critical; there is little safety in the crowd.
While indices may not offer safe harbor, we think individual stock opportunities still abound. European banks, for example, have an average forward P/E of 7.6, compared with a 10-year average of 10.9,6 and benefit greatly from rising yields. Asian travel-related businesses, whose stocks came under pressure during China’s zero-COVID policy, carry low valuations and could catch a tailwind from a rebound in travel now that lockdowns are ended.
The list goes on. But importantly, it is a curated list and rooted in the reality of today’s market – not the good old days.
ENDNOTES
1 Bureau of Labor Statistics, as of 14 February 2023.
2 World Health Organization, “Ageing and health,” 1 October 2022.
3 Bloomberg. Equity and bond return data are for the year through 13 February 2023.
4 Bloomberg, as of 14 February 2023.
5 U.S. Treasury, as of 13 February 2023.
6 Forward P/E is based on the STOXX 600 Banks Index (EUR) and based on 10-year monthly data through 14 February 2023. The STOXX 600 Banks Index is a capitalization-weighted index which includes European companies that are involved in the bank sector.

