
Copper’s price resilience over recent years is a reflection of sound market fundamentals. Demand is being driven by both traditional and new-age applications, whilst the supply-side reflects challenges around a market that’s heavily dependent upon ageing mines. I anticipate prices will recover and establish a base around $3.00/lb, which in my view is an important threshold that’s necessary to encourage new mine supply.
Copper’s price performance shows that it’s a metal that’s been in strong uptrend since a broader commodity market low that occurred during late 2015/early 2016, coincident with a bottoming of negative sentiment related to a perceived Chinese economic slowdown and a somewhat sluggish world growth picture.
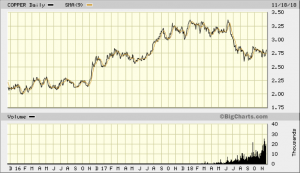
Figure 1: 3-Year Copper Price Performance
Copper is also significant from a broader perspective, because of the metal’s value as a barometer of economic health generally, representing a staple component of construction and infrastructure building. More recently we’ve seen a consolidation in copper’s price performance as a result of trade concerns and strength in the US dollar related to rising interest rates.
What’s important to remember though is that physical markets (represented by the buyers who actually take delivery of commodities to meet real-world demand) often ignore concerns around growth, the dollar and rising interest rates. This is pure and simply because the world doesn’t stop consuming important commodity staples simply because of factors that might sideline financial traders.
Nevertheless, the contrasting fortunes of copper versus the US dollar over the past 12 months are clearly evident in the graphic below. What it reflects is that whilst copper has experienced periods of selling, the lows continue to be higher, even with the rising US dollar over the past few months. If the US dollar were to resume its downtrend, copper could see more dramatic price upside.
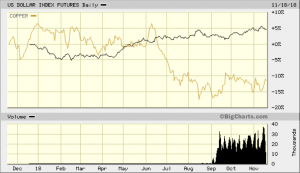
Figure 2: 1-year Copper Price Performance v US$ Index
It’s also important to examine what’s currently happening with respect to copper stockpiles. The London Metals Exchange (LME) is the most liquid exchange for trading base metals and the level of warehouse stocks can influence the price of commodities when it comes to the supply and demand picture.
What the graphic below reflects is that the copper price recovery that took place from late 2015 onwards had its origins in the dramatic plunge in LME stockpiles that began in mid-2013. Since the recovery in copper prices, LME stockpiles have existed in a range just below 150,000t at their low-point and just shy of 400,000t at their peak.
In this context, markets are right to be nervous about future supply. The world is increasingly relying on ageing mines with falling grades, with higher operating costs. Higher prices are therefore, in my view, a reality.
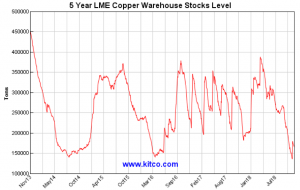
Figure 3: 5-year LME Copper Inventory Levels
Nevertheless, copper has had to grapple with political-related uncertainty in the form of a trade battle (let’s not call it a war just yet), something for which markets have a particular distaste. Tariffs and subsidies are political instruments that interfere with free market price action in copper and other materials, whilst protectionism impedes the flow of free trade and can distort supply and demand fundamentals. Therefore, it’s not surprising that copper’s price performance has been somewhat subdued over recent months.
It’s my view however that the bullish thematic for copper remains firmly in place, based on sound demand-supply fundamentals.
Firstly, growth in copper metal demand will be driven by robust gains in building copper wire and tube, increased investment in electric power wire and cable, and advances in durable goods manufacturing output. Global demand for copper metal is likely grow by around 4% annually for the next few years on the back of robust gains in building construction expenditure. Meanwhile, increased infrastructure investment, particularly in developing countries, will further benefit copper suppliers. In addition, advances in global manufacturing output are likely to bolster the use of copper metal in transportation equipment, industrial machinery, domestic appliances, and other durable goods.
Not surprisingly, China drives the global copper metal market, accounting for more than two-fifths of world demand. The country’s massive building construction and electrical and electronic sectors consume huge volumes of copper in the production of electrical wire, pipe, personal and business electronics, as well as telecommunications equipment. Strong domestic output of motor vehicles, industrial machinery, and household appliances will continue to support copper demand in China.
We must also keep an eye on India, which is forecast by many market-watchers to register the fastest gains of any major copper metal market over the coming years. Robust increases in domestic building construction activity, driven in part by an expanding urban population and government investment, will underpin gains in Indian copper consumption.
In terms of new-age applications, copper will also have an even more important role in the growing EV infrastructure and water infrastructure sectors.
According to International Copper Association (ICA) research, growing numbers of plug-in electric vehicles (PEV) will drive demand for more than 40 million charging ports by 2027 and it’s predicted that more than 100,000 tonnes of copper will be needed to satisfy the demand just in port charging cables, charging units and wiring to electrical panels. Whilst the global PEV population currently represents just 1%-2% of current global car sales, this will likely increase to 58 million by 2027.
Copper is also likely to be a major beneficiary of the growing global water crisis. ICA research has identified that copper use in water and waste water utilities could grow to 260,000 tonnes per year by 2027. Copper already exists in large quantities throughout the water utility segment, however, as the spotlight falls on improving efficiency measures and replacing ageing infrastructure, the current demand level of 39,000 tonnes is set to grow rapidly.
Finally, let’s turn our attention to some major supply-side headaches for the copper industry. The graphics below form part of a conference presentation this year by Richard Adkerson, boss of Freeport-McMoRan. The essence of his talk was the supply headwinds impacting the copper industry, which ultimately provides another fundamental plank for a bullish copper market outlook.
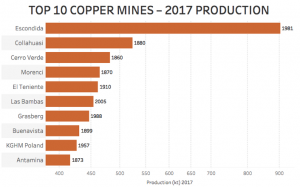
Figure 4: World’s top-ten copper mines by production
What the graphic reflects is that steady copper supply is dependent upon a few giant deposits that were discovered many generations ago and have been mined for decades. Calculations show that the median age for 2017’s top-ten copper mines in terms of production is 95 years and the ten largest mines constitute nearly 25% of annual world production.
Applying a cut-off for 2017 of 400ktpa, only one project – Oyu Tolgoi’s underground expansion – will enter the top ten in the coming decade. The Mongolian mine is expected to reach peak production of 560ktpa by 2025, following a $5.3 billion investment from Rio Tinto.
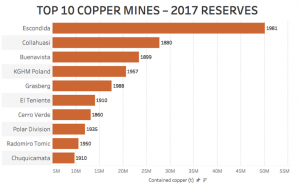
Figure 5: World’s top-ten copper mines by reserves
The latest data from the International Copper Study Group (ICSG) reflects this reliance on ageing mines. It points to a 21% year-on-year widening in the global deficit of refined copper, as refined supplies have remained stagnant. During 2017, the global refined copper balance slid to a deficit of 163,000t – compared with 135,000t recorded during 2016.
ICSG data shows that global mine output fell by 2% to 20 million tonnes during 2017, mainly attributable to a 1% decline in Chilean production (the world’s largest producer). Meanwhile lower grades at mines in Argentina, Canada, Mongolia and the USA resulted in 59%, 14%, 14% and 12% fewer tonnes of copper produced respectively. Global refined output during 2017 rose by 0.6% to 23.5 million tonnes, whilst primary production declined by 0.15% and secondary production (scrap) increased by 4.5%.
Summary
Copper’s price resilience over recent years, despite near-term uncertainty related to rising interest rates and the US currency, is a reflection of sound copper market fundamentals. Demand is being driven by both traditional and new-age applications, whilst the supply-side reflects challenges around a market that’s heavily reliant on ageing mines. All of these factors point to a continuation of copper’s impressive price performance that had its genesis back in late 2015. Realistically, producers are likely to need a base-case copper price of at least $3.00/lb and most likely $3.50/lb in order to maintain production and implement expansions to provide enough supply to satisfy future demand.

