
by Aneet Chachra, CFA – Portfolio Manager
A year ago, we published a note – The average outcome (almost) never happens – showing strategist forecasts for 2022. Their average prediction called for an 8% gain in the S&P 500 Index, in line with its long-term average return. But with the index instead down 15% year-to-date,1 that projected outcome is almost certainly out of reach.
However, viewed differently these forecasters were remarkably accurate. Predicting a future asset price usually requires two estimations – the cashflow an asset will generate, and the valuation multiple the market will ascribe to that cashflow. The former is somewhat tractable through good analysis, but the latter is much, much harder to guess, as it is highly sensitive to broader market sentiment and vibes.
A year ago, these strategists also estimated that S&P 500 index earnings for 2022 would be around $230, up about 10% year-over-year. With company results for three quarters of 2022 already released and only one quarter left, the range of possible outcomes has sharply narrowed. Currently, consensus earnings expectations for 2022 average around $222-$225. It is extraordinary that despite all the events and volatility this year, realized earnings will likely end up only a few dollars less than anticipated. The forecasters appear to be right, as 2022 earnings are poised to finish up about 7-8% year-over-year, only slightly short of year-ago projections.
Unfortunately, correctly predicting future earnings is less useful than one would think. Over the long run, S&P 500 earnings and the index itself have unsurprisingly tracked each other, with both series growing at an 8% per annum average pace. But surprisingly, the correlation between year-over-year changes in annual earnings and the S&P 500 Index is almost zero!
Exhibit 1 visually shows this de minimis relationship over a one-year horizon for each year dating back to 1955. The key conclusion from this graph is that even “knowing” next year’s earnings growth in advance provides remarkably little insight into what next year’s stock price return will be. Market strategists did successfully approximate what earnings the S&P 500 would generate in 2022 yet were far off on their index price prediction.
Exhibit 1: S&P 500 annual earnings change vs. price change (%)
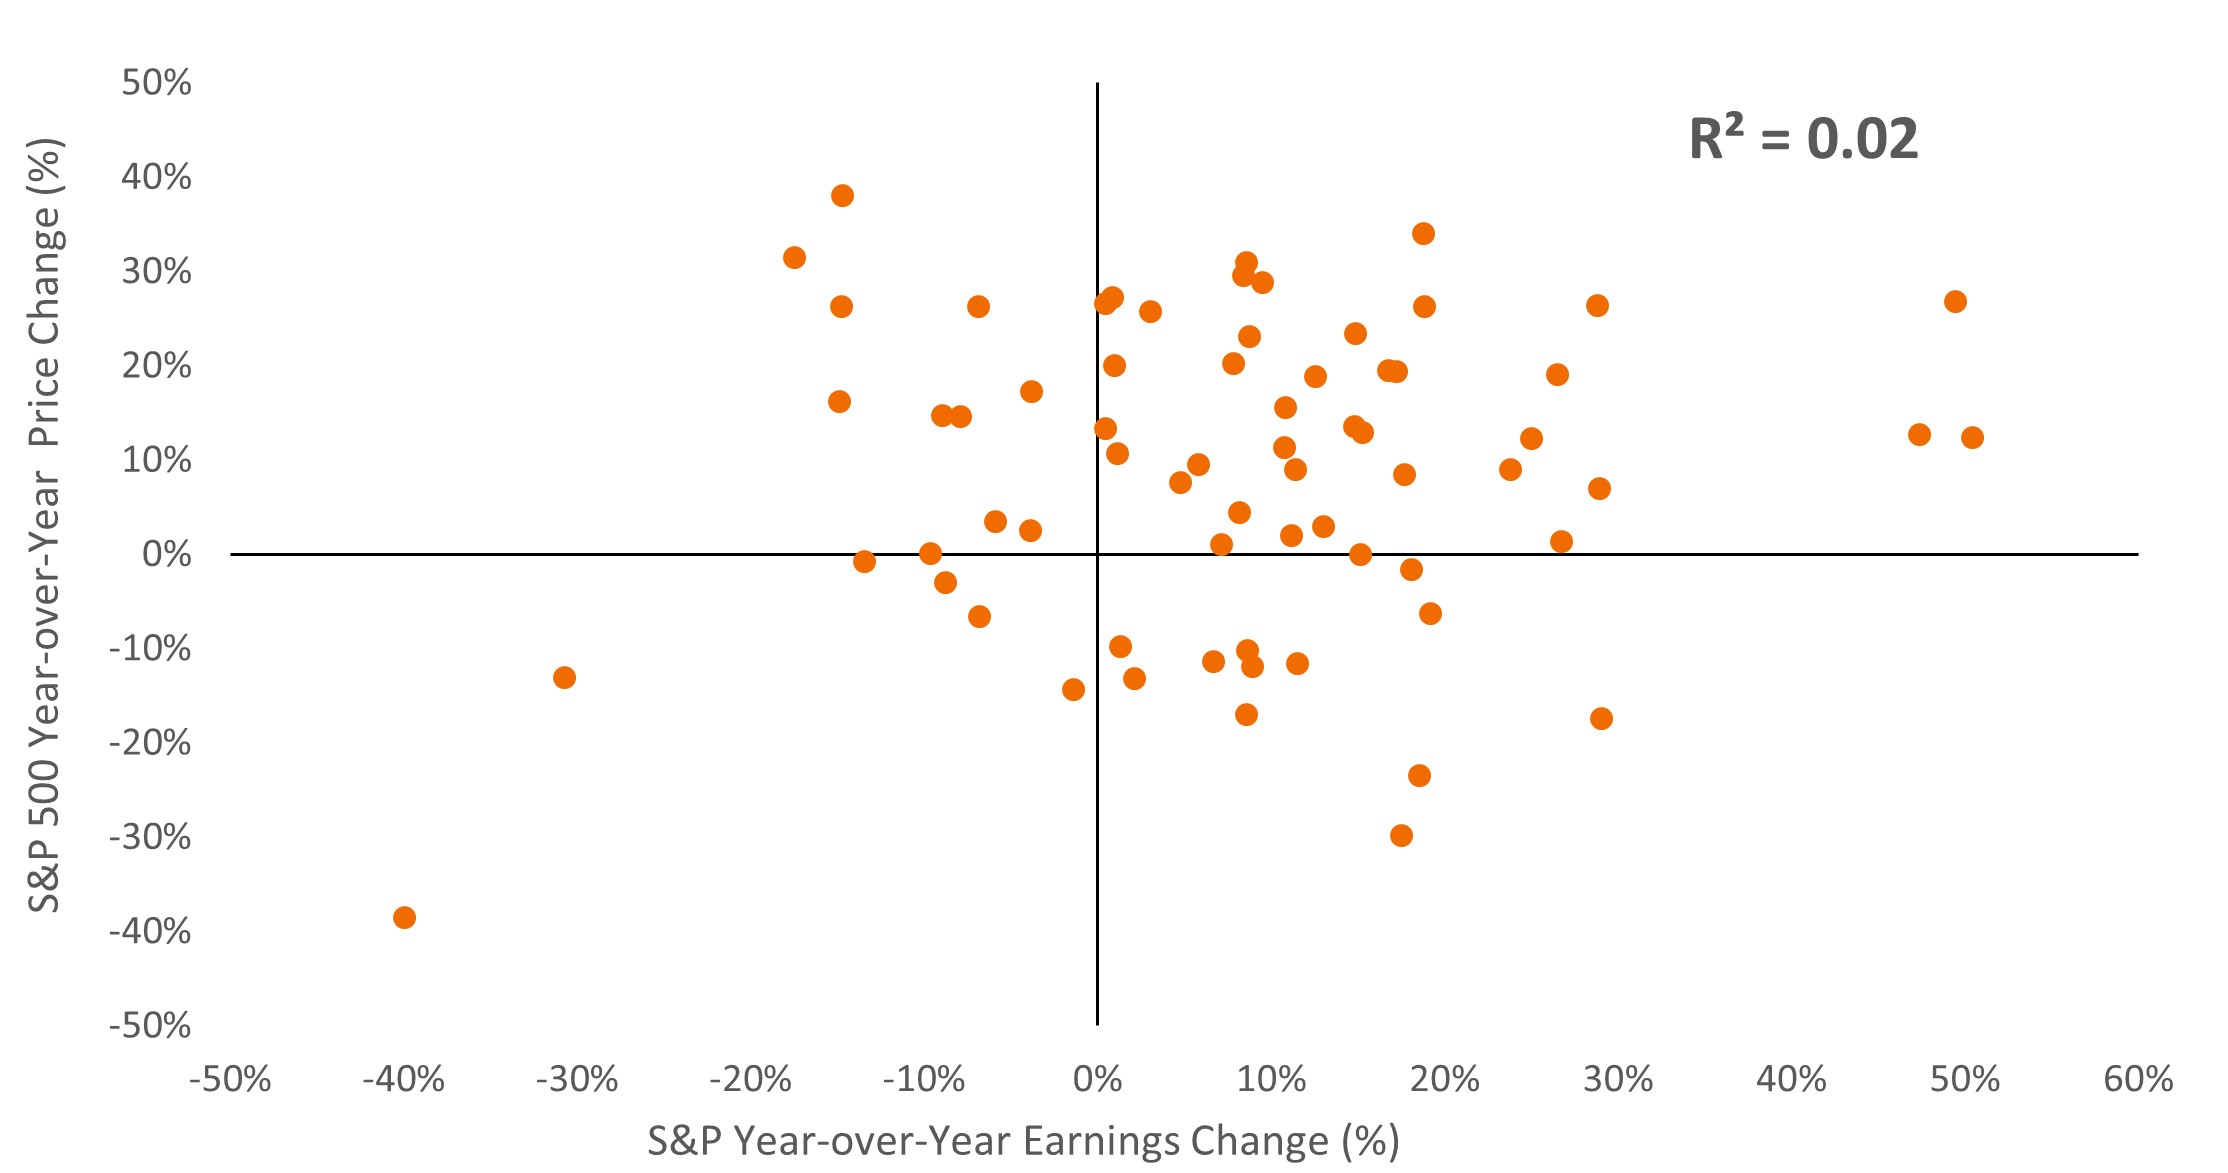
Source: Bloomberg, NYU Stern/Prof. Damodaran, as of 2 December 2022. S&P 500 Index price and earnings series from 1955 to 2022. All data points shown are for December 31 of each year, except for 2022 which is December 2 data. No transaction costs. R2 shown is the coefficient of determination between year-over-year changes in annual earnings and the S&P 500 Index; a value close to zero suggests that one-year earnings changes are not a good predictor of one-year stock price changes. Past performance does not predict future returns.
Rather the prediction miss on the S&P 500 price forecast is entirely attributable to a sharp drop in valuation multiples. At the start of 2022, the S&P 500 Index was trading at approximately 23x last 12-month earnings. This price-to-earnings multiple was more than one standard deviation above the index’s long-term average (since 1955) of about 17x.
However, the simultaneous decline in the index, coupled with a material increase in earnings, caused this ratio to contract sharply in 2022. Currently1, the index price to trailing annual earnings multiple is circa 18x, or slightly above average. Exhibit 2 shows current and historical data for this multiple over the period 1955-2022.
Exhibit 2: S&P 500 Index annual price-to-earnings ratio
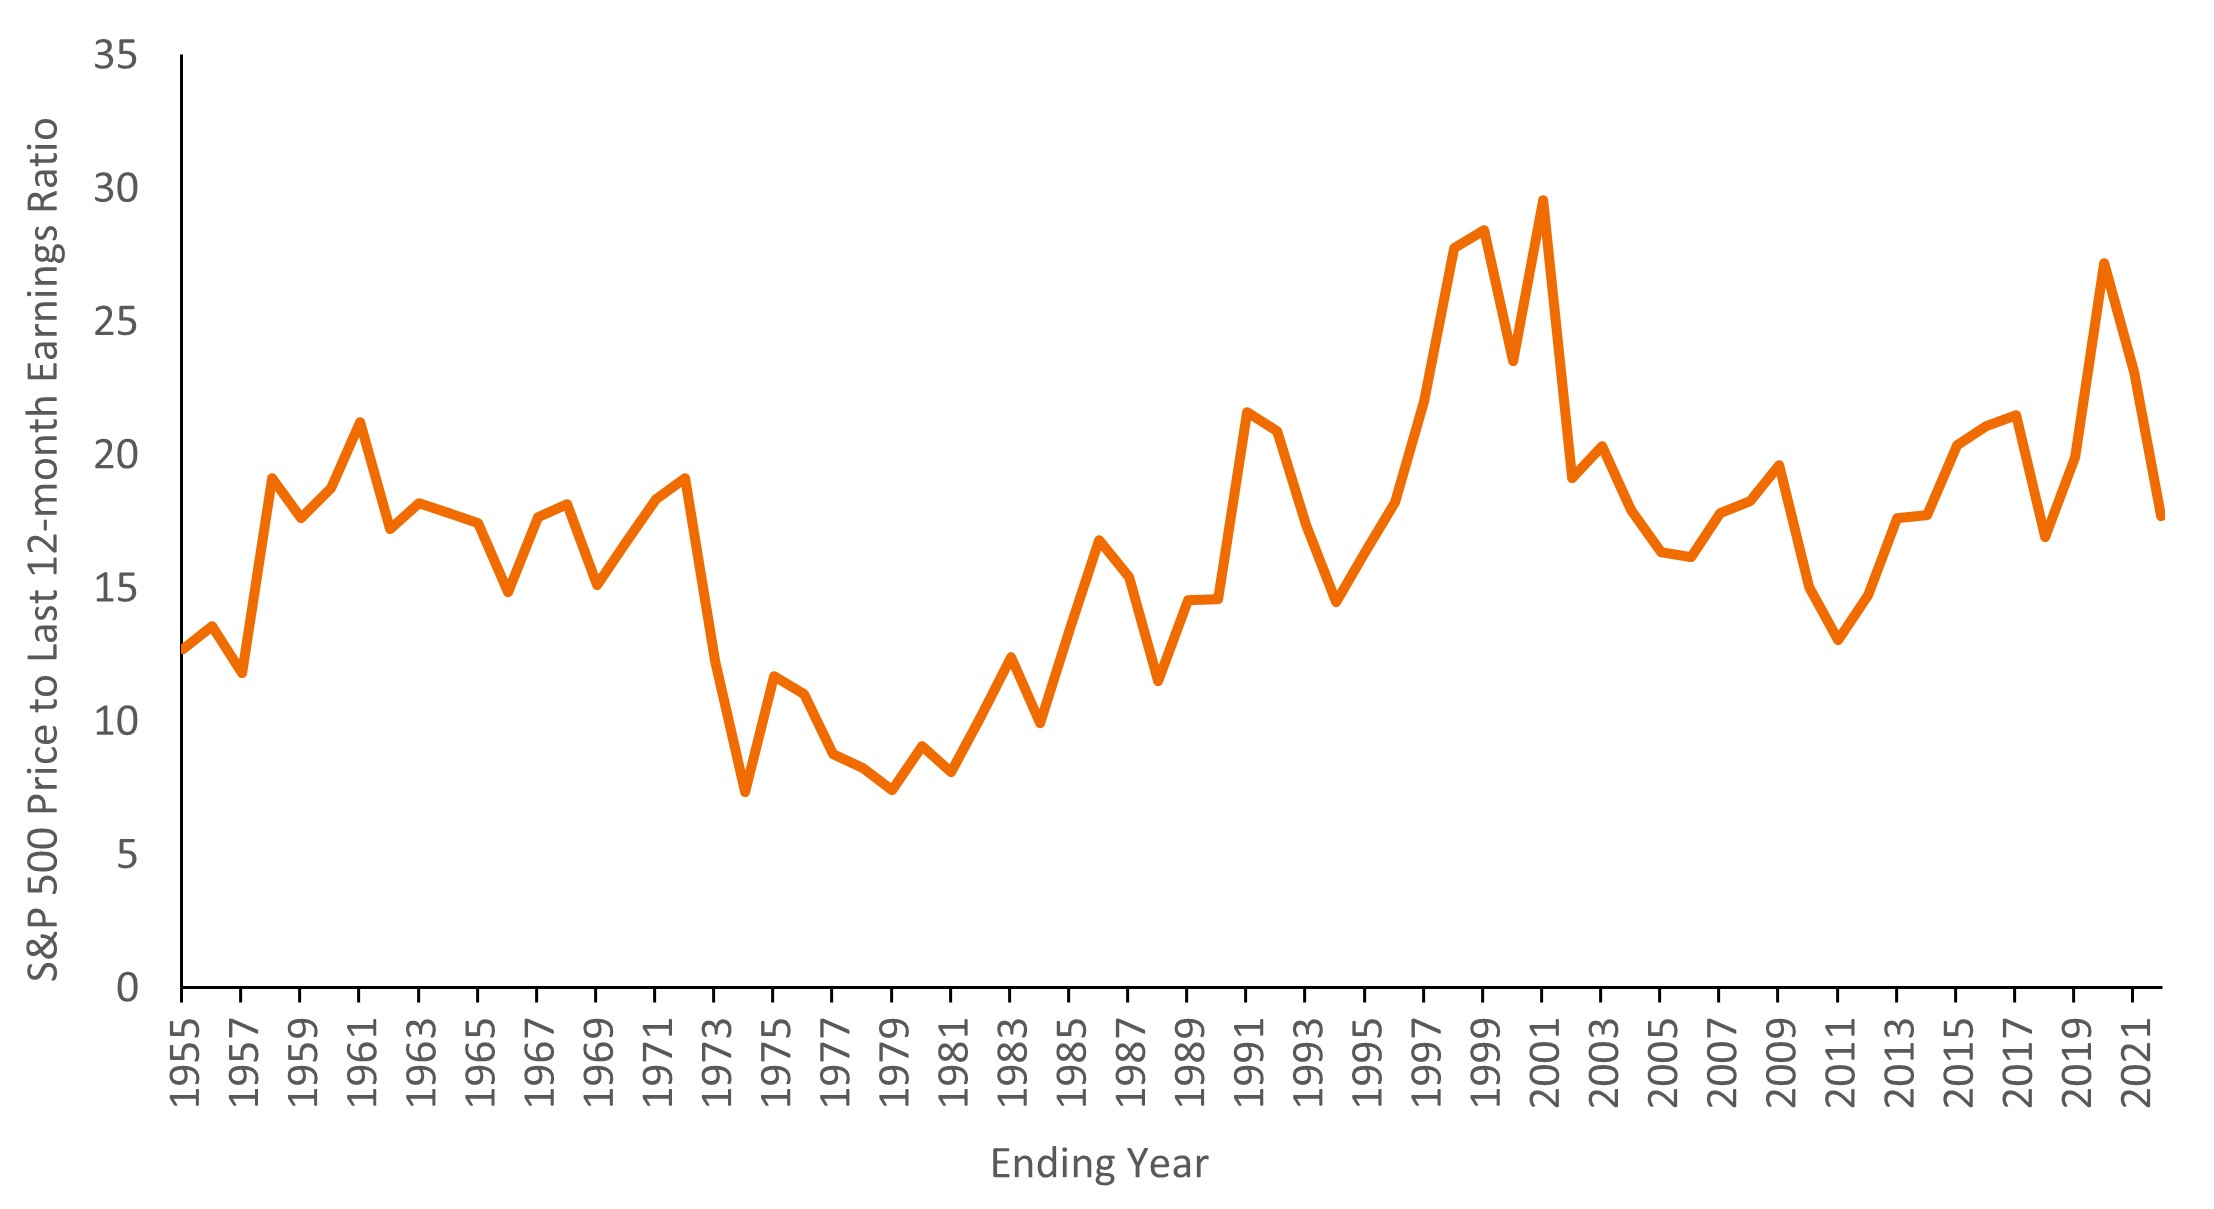
Source: Bloomberg, NYU Stern/Prof. Damodaran, as of 2 December 2022. S&P 500 Index price and earnings series from 1955 to 2022. All data points shown are for December 31 of each year, except for 2022 which is December 2 data. No transaction costs. Past performance does not predict future returns.
It is clear that the drop in equities this year was not at all about earnings, which have continued rising, but rather about multiples, which declined substantially. Market forecasters were broadly right about earnings growth, but their price forecasts got overwhelmed by multiple contraction.
Conspicuously, strategist expectations are subdued heading into 2023. Although not all firms have released projections yet, consensus calls for the S&P 500 to end 2023 around 4,000 with index earnings of about $220 next year. This is broadly flat from their 2022 levels.
We (fortunately) do not forecast either earnings or index prices but would note that realized one-year outcomes for both are quite volatile. For example, the standard deviation of both annual S&P 500 earnings and index price changes is about 16% each. Accordingly, the strategist-predicted average outcome of unchanged earnings and an unchanged index price next year would be historically unusual.
In last year’s note, we additionally showed how equity market outcomes tend to be bimodal – i.e., both above-average and below-average returns occur more frequently than the average outcome. 2022 continued this pattern as, barring an extreme move, it will end up in the below-average bucket too.
However, annual S&P 500 returns are also nearly independent, i.e. this year’s return does not significantly predict next year’s return. Consequently, we continue to believe that a well-structured portfolio should incorporate major asset classes, uncorrelated strategies, and portfolio hedges that help to protect against large, unexpected tail outcomes.

